pop pyr histogram ques
advertisement
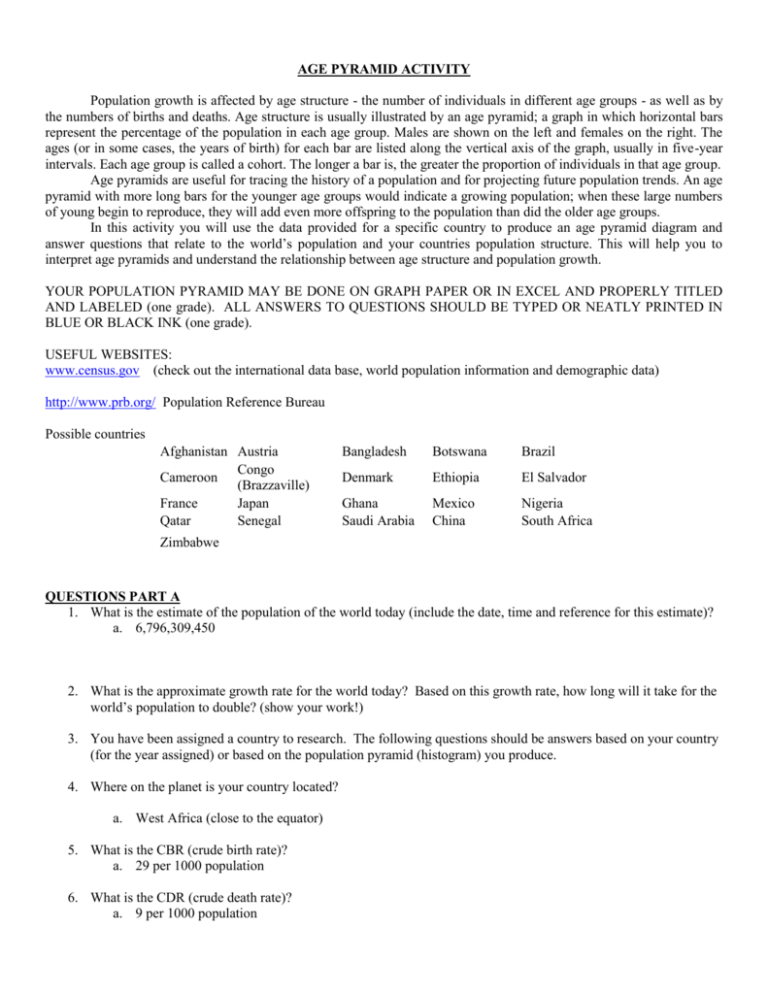
AGE PYRAMID ACTIVITY Population growth is affected by age structure - the number of individuals in different age groups - as well as by the numbers of births and deaths. Age structure is usually illustrated by an age pyramid; a graph in which horizontal bars represent the percentage of the population in each age group. Males are shown on the left and females on the right. The ages (or in some cases, the years of birth) for each bar are listed along the vertical axis of the graph, usually in five-year intervals. Each age group is called a cohort. The longer a bar is, the greater the proportion of individuals in that age group. Age pyramids are useful for tracing the history of a population and for projecting future population trends. An age pyramid with more long bars for the younger age groups would indicate a growing population; when these large numbers of young begin to reproduce, they will add even more offspring to the population than did the older age groups. In this activity you will use the data provided for a specific country to produce an age pyramid diagram and answer questions that relate to the world’s population and your countries population structure. This will help you to interpret age pyramids and understand the relationship between age structure and population growth. YOUR POPULATION PYRAMID MAY BE DONE ON GRAPH PAPER OR IN EXCEL AND PROPERLY TITLED AND LABELED (one grade). ALL ANSWERS TO QUESTIONS SHOULD BE TYPED OR NEATLY PRINTED IN BLUE OR BLACK INK (one grade). USEFUL WEBSITES: www.census.gov (check out the international data base, world population information and demographic data) http://www.prb.org/ Population Reference Bureau Possible countries Afghanistan Austria Congo Cameroon (Brazzaville) France Japan Qatar Senegal Bangladesh Botswana Brazil Denmark Ethiopia El Salvador Ghana Saudi Arabia Mexico China Nigeria South Africa Zimbabwe QUESTIONS PART A 1. What is the estimate of the population of the world today (include the date, time and reference for this estimate)? a. 6,796,309,450 2. What is the approximate growth rate for the world today? Based on this growth rate, how long will it take for the world’s population to double? (show your work!) 3. You have been assigned a country to research. The following questions should be answers based on your country (for the year assigned) or based on the population pyramid (histogram) you produce. 4. Where on the planet is your country located? a. West Africa (close to the equator) 5. What is the CBR (crude birth rate)? a. 29 per 1000 population 6. What is the CDR (crude death rate)? a. 9 per 1000 population 7. What is the rate of natural increase? a. 1.98% 8. Based on the growth rate, calculate the doubling time for this countries’ population. 9. What is the life expectancy of the male and female portions of the population? a. Male: 58.98 years b. Female:60.75 years 10. What is the infant mortality rate? a. 51 per 1000 births 11. What is the TFR (total fertility rate)? QUESTIONS PART B: ANSWER ALL THAT APPLY TO YOUR HISTOGRAM / POPULATION PYRAMID. 1. Which gender has the higher population in the youngest age groups on your pyramid? Can you account for this? 2. Which gender has the higher population in the oldest age group? Can you account for this? 3. Does your country look like a pyramid? 4. What can you tell about your country’s growth rate by looking at your histogram? 5. If birth and death rates remain the same, what will your pyramid look like in 25 years? 6. What are some factors that could change the shape of your pyramid? 7. Determine the percentage of the population that has yet to reach childbearing age. What do these numbers say about the prospects for future growth? 8. If your country is not increasing in population growth rate, what are some socio/economic problems that might occur? 9. Does your country have a baby boom in it? (a bulge in somewhere in the middle of it) What could account for this? 10. What % of your population is above age 65? What is the percentage of the population under 15? 11. The age-dependency ratio is the ratio of persons in the "dependent" ages (under 15 and over 64 years) to those in the "economically productive" ages (15-64 years) in a population. The age-dependency ratio is often used as an indicator of economic burden the productive portion of a population must carry — even though some persons defined as "dependent" are producers and some persons in the "productive" age range are economically dependent. The age dependency ratio is calculated by dividing the portion of the dependent population by the non-dependent portion of the population. Based on your answer to previous question, what is the age dependency ratio for your country? What factors do you think contribute to a high age-dependency ratio? 12. From the information graphed on your histogram, briefly discuss whether your country is increasing in population size, decreasing or at close to ZPG..)


