Advantages and Disadvantages of Break-even Analysis
advertisement
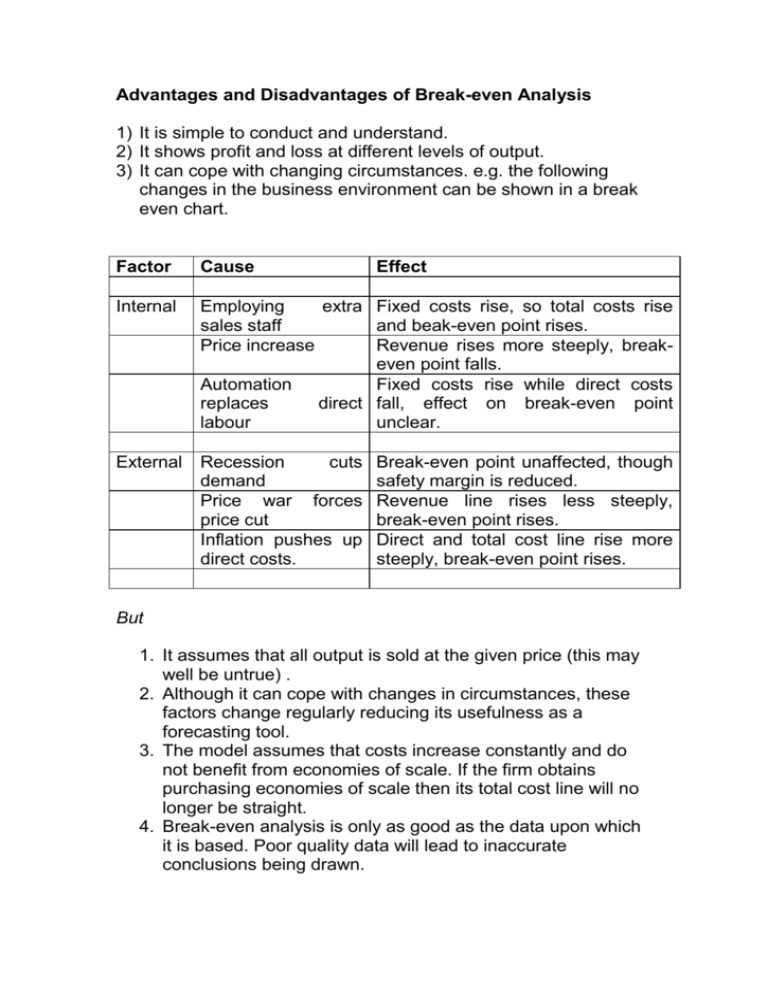
Advantages and Disadvantages of Break-even Analysis 1) It is simple to conduct and understand. 2) It shows profit and loss at different levels of output. 3) It can cope with changing circumstances. e.g. the following changes in the business environment can be shown in a break even chart. Factor Cause Internal Employing extra Fixed costs rise, so total costs rise sales staff and beak-even point rises. Price increase Revenue rises more steeply, breakeven point falls. Automation Fixed costs rise while direct costs replaces direct fall, effect on break-even point labour unclear. External Recession cuts demand Price war forces price cut Inflation pushes up direct costs. Effect Break-even point unaffected, though safety margin is reduced. Revenue line rises less steeply, break-even point rises. Direct and total cost line rise more steeply, break-even point rises. But 1. It assumes that all output is sold at the given price (this may well be untrue) . 2. Although it can cope with changes in circumstances, these factors change regularly reducing its usefulness as a forecasting tool. 3. The model assumes that costs increase constantly and do not benefit from economies of scale. If the firm obtains purchasing economies of scale then its total cost line will no longer be straight. 4. Break-even analysis is only as good as the data upon which it is based. Poor quality data will lead to inaccurate conclusions being drawn.

