Lens Lab
advertisement
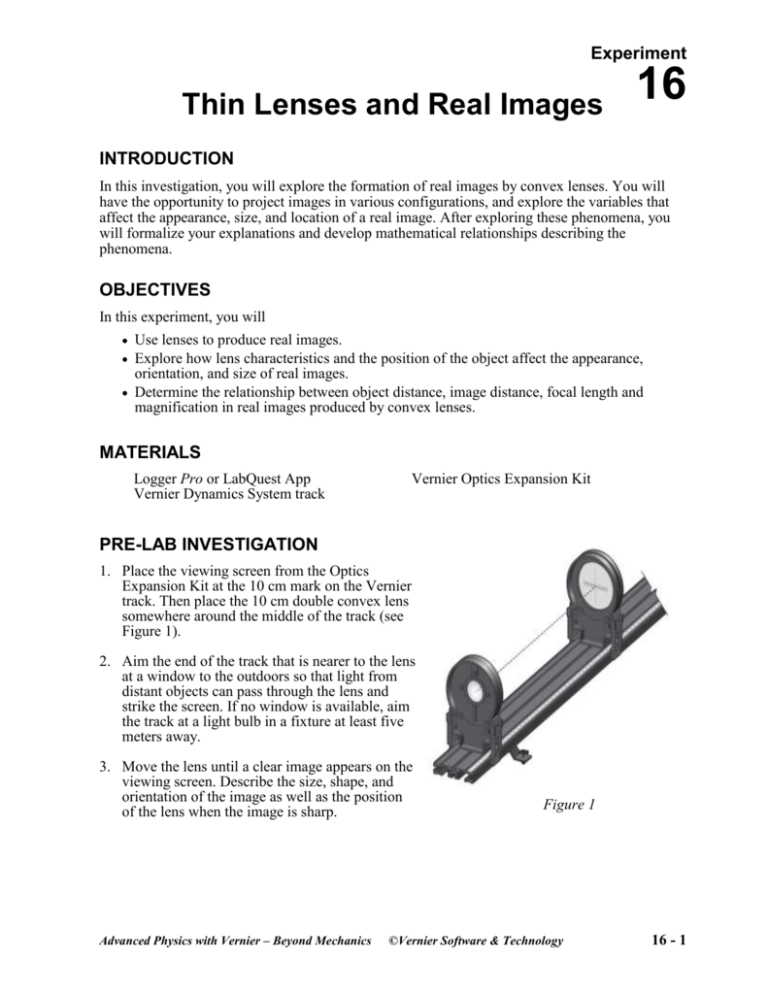
Experiment Thin Lenses and Real Images 16 INTRODUCTION In this investigation, you will explore the formation of real images by convex lenses. You will have the opportunity to project images in various configurations, and explore the variables that affect the appearance, size, and location of a real image. After exploring these phenomena, you will formalize your explanations and develop mathematical relationships describing the phenomena. OBJECTIVES In this experiment, you will Use lenses to produce real images. Explore how lens characteristics and the position of the object affect the appearance, orientation, and size of real images. Determine the relationship between object distance, image distance, focal length and magnification in real images produced by convex lenses. MATERIALS Logger Pro or LabQuest App Vernier Dynamics System track Vernier Optics Expansion Kit PRE-LAB INVESTIGATION 1. Place the viewing screen from the Optics Expansion Kit at the 10 cm mark on the Vernier track. Then place the 10 cm double convex lens somewhere around the middle of the track (see Figure 1). 2. Aim the end of the track that is nearer to the lens at a window to the outdoors so that light from distant objects can pass through the lens and strike the screen. If no window is available, aim the track at a light bulb in a fixture at least five meters away. 3. Move the lens until a clear image appears on the viewing screen. Describe the size, shape, and orientation of the image as well as the position of the lens when the image is sharp. Advanced Physics with Vernier – Beyond Mechanics Figure 1 ©Vernier Software & Technology 16 - 1 Experiment 16 4. Repeat this process, using the 20 cm double convex lens. Make note of the similarities and differences in the images produced by the two lenses. In your class discussion, you will learn how the use of ray diagrams can help you to determine how and where light from a particular point on an object converges to form an image. You can get a conceptual understanding of the process of image-formation by a lens using the “Geometric Optics” simulation available from the PhET web site.1 PROCEDURE 1. Set up the light source and lens to project a clear image on the screen. a. Attach the light source assembly from the Optics Expansion Kit to the Vernier track. Position it so that the pointer in the base is at the 10 cm mark and the light source faces the other end of the track. b. Place the 10 cm double convex lens on the track, at the 25 cm mark. c. Attach the screen to the track and position it so that light from the light source passes through the lens and strikes the screen. d. Turn the light source wheel until the number “4” is visible in the opening. This will be your “object” for this investigation. e. Adjust the position of the screen until the image of the “4” on the screen is in focus (see Figure 2). One approach to obtain the sharpest image, once you think you have it, is to move the screen until the image begins to blur, then move it back until it again appears sharp. Figure 2 1 http://phet.colorado.edu/en/simulation/geometric-optics 16 - 2 Advanced Physics with Vernier – Beyond Mechanics Thin Lenses and Real Images 2. Describe the size, shape, and orientation of the image. 3. Record the distance between the light source and the lens as “object distance” and the distance between the lens and the screen as “image distance” in your lab notebook. 4. Obtain object distance and image distance data for five more points over as wide a range as is practical. Note what happens to the size of the image as the object distance increases. 5. Return the lens to the 25 cm mark on the track. Gradually move the lens closer to the light source. When it reaches the 20 cm mark, can you find a position for the screen where the image is in focus? 6. Repeat Steps 1–4 using the 20 cm double convex lens with the exception that you should first position the lens at the 35 cm mark. For this lens position, you will need to hold the screen beyond the end of the track to obtain a sharp image. 7. After you have obtained at least six data points, return the lens to the 35 cm mark, then gradually move the lens closer to the light source. Note the smallest object distance where you cannot obtain a focused image, no matter where the screen is placed. EVALUATION OF DATA 1. Choose New from the File menu in the data-collection program. In the table, manually enter your data for your measurement with the 10 cm lens. Enter d-o (for object distance) and d-i (for image distance) as the Names of the columns. 2. Examine your graph of image distance vs. object distance. What relationship appears to exist between these variables? Rather than performing a curve fit to the data, take steps to modify one of the variables so as to produce a linear graph. Using Logger Pro Choose New Calculated Column from the Data menu. After entering a name and units for the column, click the equation field, enter the expression to modify the variable you choose from the drop-down menu, and then click Done. Change the variable on the axis you have chosen to modify to see the resulting graph. Using LabQuest App Choose New Calculated Column from the Table menu. After choosing a name and units for the column, select A/X as the Equation Type. Enter the column you wish to modify, then select OK. Tap the Graph tab and change the variable on the axis you have chosen to modify to see the resulting graph. You may find it necessary to modify the variables on both axes to linearize the graph. When you have done so, write the equation of the best-fit line. 3. Examine the value and the units of the slope. Discuss with your instructor what the ideal value of the slope might be. 4. Examine the value and units of the vertical intercept. In view of the modifications you made to the object distance and image distance in order to produce a linear graph, draw a conclusion about the physical significance of the intercept. Advanced Physics with Vernier – Beyond Mechanics 16 - 3 Experiment 16 5. If you are using Logger Pro, add a New Data Set to your file and repeat Steps 1 and 2 with your measurements for the 20 cm convex lens. If you are using LabQuest App, start a new file to do this. 6. Examine your slope and intercept as you did earlier. Are your findings consistent with those for the 10 cm lens? 7. Write a general equation of your best-fit line in terms of di, do, and f; rearrange the equation so that di and do are on the same side. Compare your results to the thin-lens equation in your text or a web-based resource. 8. The magnification, m, of an image is the ratio of the image height, i, to the object height, o. Using similar triangles, one can show that it is also equal to the ratio of the image distance to the object distance. m i d i o do Note: the negative sign is included as part of the convention to indicate that the real image is inverted. Using the 10 cm double convex lens, find a configuration of the lens and the screen that produces an image of the “4” used as the object that measures 4 mm across. Measure di and do and compare the agreement between the two ratios. Repeat this process for an image that is twice as large. The “4” on the light source is 20 mm across. EXTENSIONS 1. Suppose you had used a 15 cm double convex lens in your experiment. Predict the slope and the intercept for the graph of 1/di vs. 1/do. 2. When you sketched ray diagrams to show the location and size of a real image, you most likely used the principal rays. Suppose half of the lens were covered by a piece of dark paper so that two of these rays (parallel to the optical axis and passing through the center of the lens) were blocked. Could an image form under these circumstances? Try it with your apparatus; record your findings. Re-visit the PhET simulation “Geometric Optics” and choose the Many Rays option to help you understand your results. 16 - 4 Advanced Physics with Vernier – Beyond Mechanics


