The Effects of Exercise on Respiration
advertisement
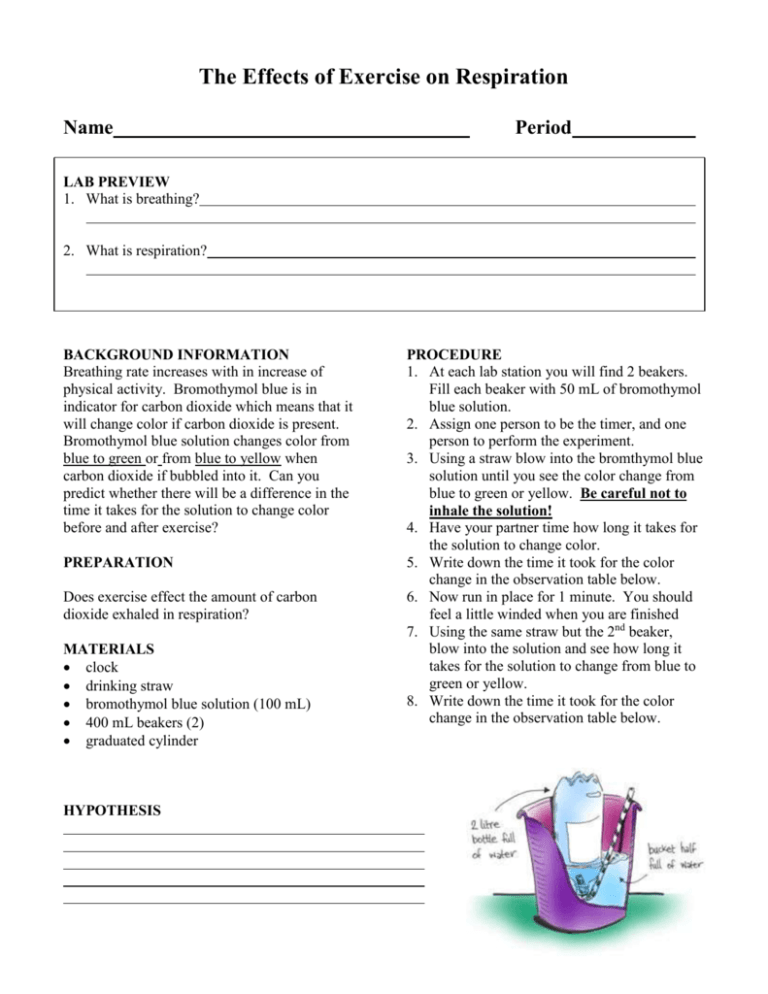
The Effects of Exercise on Respiration Name Period LAB PREVIEW 1. What is breathing? 2. What is respiration? BACKGROUND INFORMATION Breathing rate increases with in increase of physical activity. Bromothymol blue is in indicator for carbon dioxide which means that it will change color if carbon dioxide is present. Bromothymol blue solution changes color from blue to green or from blue to yellow when carbon dioxide if bubbled into it. Can you predict whether there will be a difference in the time it takes for the solution to change color before and after exercise? PREPARATION Does exercise effect the amount of carbon dioxide exhaled in respiration? MATERIALS clock drinking straw bromothymol blue solution (100 mL) 400 mL beakers (2) graduated cylinder HYPOTHESIS PROCEDURE 1. At each lab station you will find 2 beakers. Fill each beaker with 50 mL of bromothymol blue solution. 2. Assign one person to be the timer, and one person to perform the experiment. 3. Using a straw blow into the bromthymol blue solution until you see the color change from blue to green or yellow. Be careful not to inhale the solution! 4. Have your partner time how long it takes for the solution to change color. 5. Write down the time it took for the color change in the observation table below. 6. Now run in place for 1 minute. You should feel a little winded when you are finished 7. Using the same straw but the 2nd beaker, blow into the solution and see how long it takes for the solution to change from blue to green or yellow. 8. Write down the time it took for the color change in the observation table below. OBSERVATION TABLE Exercise Time (color change) Pulse Exercise ______, Before Exercise ______, After What was your exercise? _______________________ ANALYZE AND APPLY 1. What is the function of the respiratory system? 2. What caused the bromothymol blue solution to change color? 3. Compare the time it took the bromothymol blue solution to change color before exercise and after exercise. 4. Explain the difference in question #2 5. What is the manipulated variable or the factor purposely changed to test your hypothesis? 6. Look at your observation table and make a graph of your results. Don’t forget a title and to label the X and Y axis. Also remember to have equal spacing between numbers that go in order. . .no skipping #s with a symbol. Remember to label the X and Y axis. 7. Using your graph, estimate the time of color change if the time of your physical activity were twice as long.
