ch05
advertisement
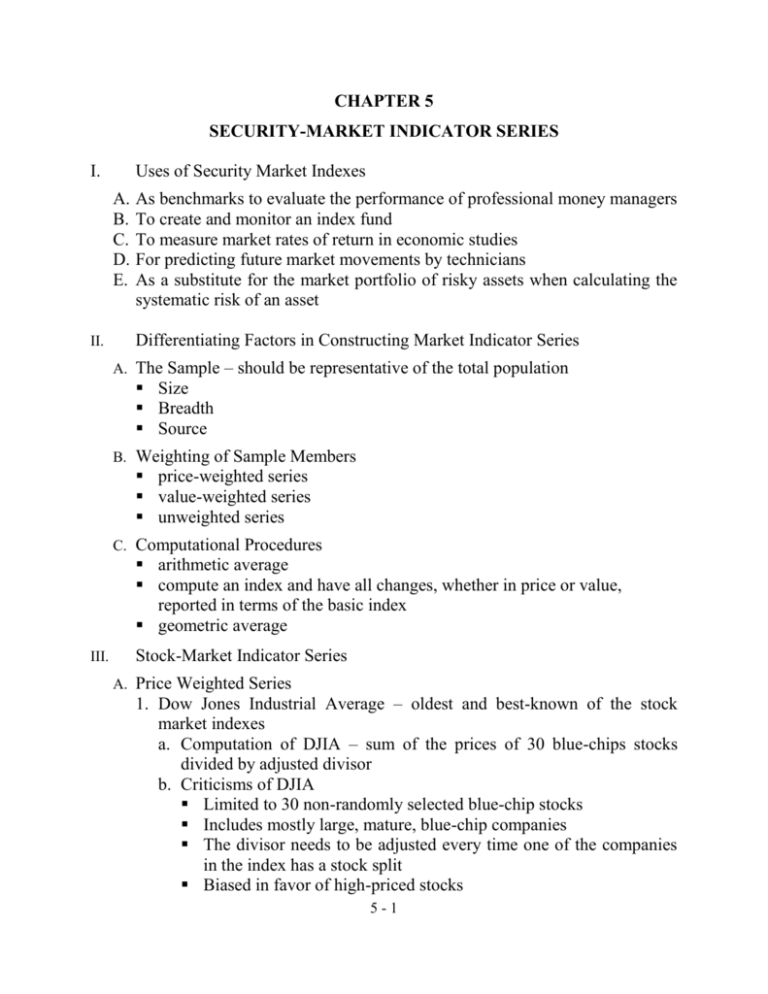
CHAPTER 5 SECURITY-MARKET INDICATOR SERIES I. Uses of Security Market Indexes A. B. C. D. E. II. As benchmarks to evaluate the performance of professional money managers To create and monitor an index fund To measure market rates of return in economic studies For predicting future market movements by technicians As a substitute for the market portfolio of risky assets when calculating the systematic risk of an asset Differentiating Factors in Constructing Market Indicator Series A. The Sample – should be representative of the total population Size Breadth Source B. Weighting of Sample Members price-weighted series value-weighted series unweighted series C. Computational Procedures arithmetic average compute an index and have all changes, whether in price or value, reported in terms of the basic index geometric average III. Stock-Market Indicator Series A. Price Weighted Series 1. Dow Jones Industrial Average – oldest and best-known of the stock market indexes a. Computation of DJIA – sum of the prices of 30 blue-chips stocks divided by adjusted divisor b. Criticisms of DJIA Limited to 30 non-randomly selected blue-chip stocks Includes mostly large, mature, blue-chip companies The divisor needs to be adjusted every time one of the companies in the index has a stock split Biased in favor of high-priced stocks 5-1 c. Dow Jones also publishes a 20 stock transportation average and a 15 stock utility average 2. Nikkei-Dow Jones Average (Nikkei Stock Average Index) a. 225 stocks on the First Section of the TSE b. Criticisms of Nikkei-Dow Is a price-weighted series. Hence, it suffers from the same shortcomings of the DJIA Stocks included in the index comprise only about 15 percent of all stocks on the First Section of the Tokyo Stock Exchange B. Value Weighted Series 1. General computational procedure (See Exhibit 5.3) 2. Automatic adjustment for stock split 3. Examples of value weighted series (See Exhibit 5.5) a. Standard and Poor's Indexes b. New York Stock Exchange Index c. NASDAQ Series d. American Stock Exchange Market Value Index e. Wilshire 5000 Equity Index f. Russell Indexes g. Financial Times Actuaries Indexes h. Tokyo Stock Exchange Price Index i. FT-Actuaries World Indexes j. Morgan Stanley Capital International Indexes k. Dow Jones World Stock Index l. Euromoney-First Boston Global Stock Index m. Salomon-Russell World Equity Index C. Unweighted Price Indicator Series 1. General computational procedure – all stocks in an unweighted index carry equal weight regardless of their price or market value 2. Examples of unweighted series a. Value Line Averages b. Financial Times Ordinary Share Index 3. Arithmetic and Geometric Means (See Exhibit 5.8) D. Global Equity Indexes 1. FT/S&P - Actuaries World Indexes (See Exhibit 5.9) 2. Morgan Stanley Capital International (MSCI) Indexes (See Exhibits 5.10 and 5.11) 5-2 3. Dow Jones World Stock Index (See Exhibit 5.12) 4. Comparison of World Stock Indexes – strong positive correlation between the three series mentioned above E. Bond-Market Indicator Series 1. Investment-Grade Bond Indexes (See Exhibit 5.13) a. Lehman Brothers b. Merrill Lynch c. Ryan Treasury d. Salomon Smith Barney 2. High-Yield Bond Indexes a. U.S. High-Yield Bond Indexes (See Exhibits 5.13 and 5.14) b. Merrill Lynch Convertible Securities Indexes 3. Global Government Bond Market Indexes IV. Composite Stock-Bond Indexes A. Merrill Lynch-Wilshire U.S. Capital Markets Index (ML-WCMI) B. Brinson Partners Global Security Market Index (GSMI) V. Mean Annual Security Risk-Returns and Correlations A. There are clear differences among the series due to different asset classes (e.g., stocks versus bonds) and when there are different samples within asset classes B. There is a positive relationship between the rate of return on an asset and its measure of risk C. The security market indexes can be used: to measure the historical performance of an asset class as benchmarks to evaluate the performance of a money manager for a mutual fund, a personal trust, or a pension plan 5-3
