EXERCISES1
advertisement
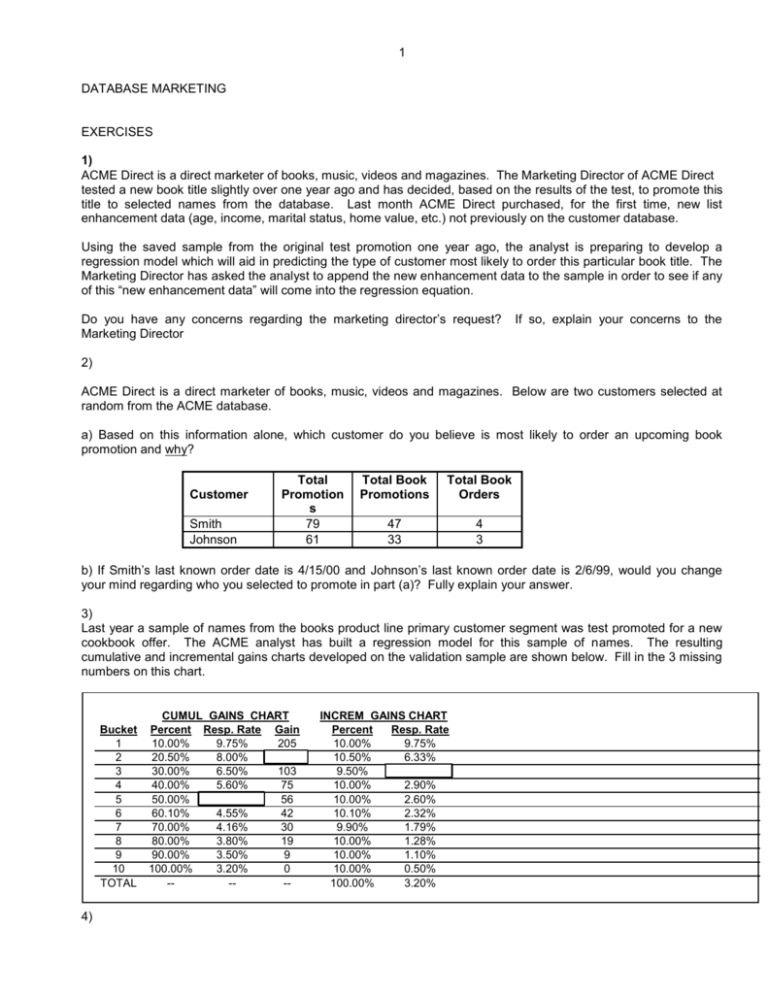
1 DATABASE MARKETING EXERCISES 1) ACME Direct is a direct marketer of books, music, videos and magazines. The Marketing Director of ACME Direct tested a new book title slightly over one year ago and has decided, based on the results of the test, to promote this title to selected names from the database. Last month ACME Direct purchased, for the first time, new list enhancement data (age, income, marital status, home value, etc.) not previously on the customer database. Using the saved sample from the original test promotion one year ago, the analyst is preparing to develop a regression model which will aid in predicting the type of customer most likely to order this particular book title. The Marketing Director has asked the analyst to append the new enhancement data to the sample in order to see if any of this “new enhancement data” will come into the regression equation. Do you have any concerns regarding the marketing director’s request? Marketing Director If so, explain your concerns to the 2) ACME Direct is a direct marketer of books, music, videos and magazines. Below are two customers selected at random from the ACME database. a) Based on this information alone, which customer do you believe is most likely to order an upcoming book promotion and why? Customer Smith Johnson Total Promotion s 79 61 Total Book Promotions Total Book Orders 47 33 4 3 b) If Smith’s last known order date is 4/15/00 and Johnson’s last known order date is 2/6/99, would you change your mind regarding who you selected to promote in part (a)? Fully explain your answer. 3) Last year a sample of names from the books product line primary customer segment was test promoted for a new cookbook offer. The ACME analyst has built a regression model for this sample of names. The resulting cumulative and incremental gains charts developed on the validation sample are shown below. Fill in the 3 missing numbers on this chart. Bucket 1 2 3 4 5 6 7 8 9 10 TOTAL 4) CUMUL GAINS CHART Percent Resp. Rate Gain 10.00% 9.75% 205 20.50% 8.00% 150 30.00% 6.50% 103 40.00% 5.60% 75 50.00% 5.00% 56 60.10% 4.55% 42 70.00% 4.16% 30 80.00% 3.80% 19 90.00% 3.50% 9 100.00% 3.20% 0 ---- INCREM GAINS CHART Percent Resp. Rate 10.00% 9.75% 10.50% 6.33% 9.50% 3.26% 10.00% 2.90% 10.00% 2.60% 10.10% 2.32% 9.90% 1.79% 10.00% 1.28% 10.00% 1.10% 10.00% 0.50% 100.00% 3.20% 2 Using the gains charts shown in Question #4 the Senior Product Manager at ACME Direct will determine who to promote for his upcoming cookbook promotion. To ensure 5% profit-after-overhead for this campaign, the Senior Product Manager has determined he should not promote any group of customers with a response rate below 4.00%. If the primary customer segment for the books product line (the universe the regression model was built on) represents 3,450,000 names, a) How many names should the senior product manager promote? b) What will be his expected number of orders in roll-out? 5) Answer the following questions regarding regression analysis: a) What causes multicollinearity? b) Please describe two ways one can identify that multicollinearity is present in a model. a) Please describe two ways that one can rid a model of multicollinearity. 6) ACME Direct, a direct marketer of book, music, videos and magazines, has built a multiple regression model predicting who is likely to order a World War II video set based on a saved sample of 9,994 names promoted for this product last fall. Below is a copy of the EXCEL output from the regression run. The dependent variable was the typical binary indicator (1=order, 0=silent). Observations Intercept TSLO NM_VIDORDS RATIO_PDPR GNDR_MALE 9 994 Coefficients 0.1385 -0.0159 0.0785 0.6385 0.1748 P-value 0.0395 0.0459 0.0001 0.0043 0.0175 TSLO = Elapsed time, in months, since last order of any kind NM_VIDORDS = Total number of video orders ever made RATIO_PDPR = Ratio of total products paid across all product lines to total promotions sent across all product lines GNDR_MALE = 1 if male, 0 otherwise Score customer Jones and Matthews on the above equation and indicate which one is most likely to order this video product. Assume today’s date is 5/1/00. Customer Last Order Date Jones Matthews 1/1/00 10/1/99 Total Promotions Sent (All Product Lines) 35 66 Total Paid Orders (All Product Lines) 3 7 Total Video Orders Gender 1 3 male unknown 3 7) You carried out test marketing to find a scoring rule to be applied in a target segment of 100000 customers. Assume your expected margin is 20 if someone responds to a promotion and the promotion cost is 1 Does the model look strong/good for you? Looking at the charts below originating from a regression model used in the test marketing sample, calculate what percentage of customers you are going to promote if you need to have an expected return exceeding 0 for every promoted customer. If you then promote this percentage of customers, what is the expected number of responses you are going to get.
