syllabus - Villanova University
advertisement

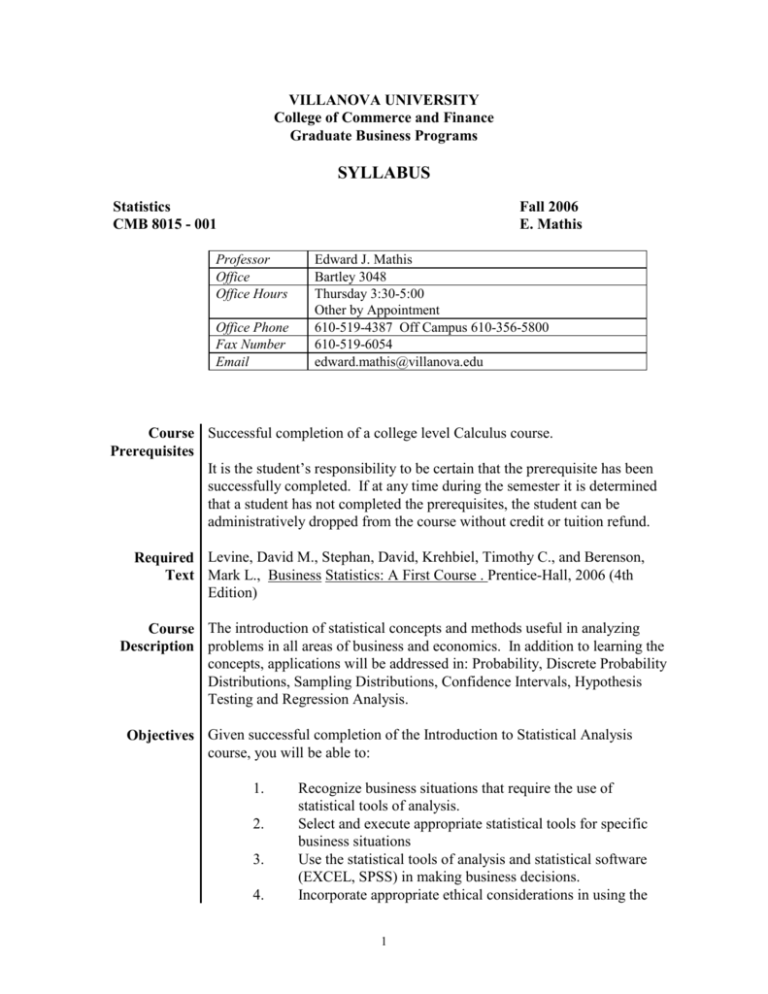
VILLANOVA UNIVERSITY College of Commerce and Finance Graduate Business Programs SYLLABUS Statistics CMB 8015 - 001 Fall 2006 E. Mathis Professor Office Office Hours Office Phone Fax Number Email Edward J. Mathis Bartley 3048 Thursday 3:30-5:00 Other by Appointment 610-519-4387 Off Campus 610-356-5800 610-519-6054 edward.mathis@villanova.edu Course Successful completion of a college level Calculus course. Prerequisites It is the student’s responsibility to be certain that the prerequisite has been successfully completed. If at any time during the semester it is determined that a student has not completed the prerequisites, the student can be administratively dropped from the course without credit or tuition refund. Required Levine, David M., Stephan, David, Krehbiel, Timothy C., and Berenson, Text Mark L., Business Statistics: A First Course . Prentice-Hall, 2006 (4th Edition) Course The introduction of statistical concepts and methods useful in analyzing Description problems in all areas of business and economics. In addition to learning the concepts, applications will be addressed in: Probability, Discrete Probability Distributions, Sampling Distributions, Confidence Intervals, Hypothesis Testing and Regression Analysis. Objectives Given successful completion of the Introduction to Statistical Analysis course, you will be able to: 1. 2. 3. 4. Recognize business situations that require the use of statistical tools of analysis. Select and execute appropriate statistical tools for specific business situations Use the statistical tools of analysis and statistical software (EXCEL, SPSS) in making business decisions. Incorporate appropriate ethical considerations in using the 1 tools of statistical analysis. Specifically, after completing this course, the student will be able to: Use Descriptive Statistics and Probability Distributions A. B. C. D. E. F. G. Distinguish between descriptive and inferential statistics. Effectively present data in the form of tables, charts, graphs, etc. Calculate and interpret measures of central tendency and variation and explain the advantages and disadvantages of each. Use the measures of central tendency and variation to describe data sets and make comparisons Understand the rules of probability and their applications; calculate probabilities by applying the rules of addition and multiplication. Apply Bayes theorem in the business environment. Identify discrete and continuous probability distributions and use them to analyze business situations. Apply Methods of Inferential Statistics H. I. J. Explain why a sample is the only feasible way to learn about a population and recognize various techniques for taking a sample. Use statistical inference (confidence intervals) to estimate population characteristics such as the mean, proportion, difference of two means, and difference of two proportions. Draw conclusions concerning population characteristics by conducting tests of hypothesis. Analyze using Regression and Correlation Techniques K. L. Describe the relationship between a dependent variable and one or more independent variables. Conduct simple and multiple regression and correlation analysis Communicate Effectively and Address Ethical Issues M. N. Generate and interpret statistical results from computer software such as EXCEL or SPSS. Write an executive summary and/or report to analyze either an original business problem using statistical techniques or a 2 O. Topical I. Coverage case study offered by the professor. Recognize that statistical techniques can be used either improperly or unethically Descriptive Statistics and Probability Distributions (Chapters 1,2,3,4,5,6) II. Methods of Inferential Statistics (Chapters (7,8,9,10) III. Correlation and Regression Analysis (Chapters 12,13) A detailed schedule of topical coverage is found at the end of the syllabus. To assist with the analysis of the chapter problems, homework and class discussions, the course will use Microsoft Excel and PH Stat II . Ethical business situations will be discussed where applicable. Teaching The class will meet for lectures and discussion on the theory and Method applications of statistics. All students are expected to have attempted relevant problems before class. Class participation will be encouraged and expected. The class will move at a rapid pace in order to cover all the necessary material. Please do not fall behind. This course will be taught in two parts. In the first part of the course, the basic tools of descriptive statistics will be reviewed and introduced. These topics include descriptive statistics, probability theory, discrete distributions and continuous distributions. The second part of the course will deal with inferential statistics and applied statistical methods including estimation, hypothesis testing, regression analysis and time series analysis. Ethical business situations will be discussed with respect to the appropriate statistical tool. If you have a disability that may affect your success in this course and wish to discuss academic accommodations, please arrange to meet with me as soon as possible and not later than the end of the second week of the semester. Homework Homework problems will be assigned for each chapter after the class has Assignments been taught. The assignment will be emailed to you. After they are assigned I will email the solutions to the problems on the Tuesday after the class from which they were assigned and before the next class. Questions about the homework assignments will be answered at the beginning of the next class. It is the responsibility of every student to work out the assigned problems. Homework will not be collected but it is easier to understand the subsequent, cumulative material if assignments are completed on a timely 3 basis. Many of the homework assignments will come from the Practice Problems Project Students are required to do a computer project using regression and correlation analysis. Detailed instructions for the project will be emailed in October. The report on this project is due on December 19, 2006. There is a penalty if the project is late. Attendance It is important that students attend all classes and be prepared prior to the class. Attendance is critical because some course material is developed that is not directly covered in the text or is presented in a different way. Repeated absence will probably have an adverse effect on your knowledge of the subject matter. Students who miss a class are responsible for any assignments. Attendance records may be kept and have some relevance in grade-determination. Grade A midterm examination, a computer project using regression and correlation Determination analysis and a final examination will be among the testing tools used. The examinations are cumulative. Class participation is taken into consideration, especially if one has a grade that is in a borderline position. All examinations are open book and open notes. The computer will be used in all exams. Midterm Exam – 30% Final Exam – 50% Project - 20% THERE WILL BE NO EXTRA CREDIT. Exam Schedule Midterm Exam I – Thursday, October 26,2006 Project Due Date – Tuesday, December 19, 2006 Final Exam - Thursday, December 14, 2006 Make-up All make-ups are scheduled at a common time AFTER the end of the Exam Policy semester. Computer To assist with the analysis of the chapter problems and class discussions, Materials this course will use Microsoft Excel. Instructions on using Microsoft Excel are included in special Excel sections of the text chapters. A statistics add-in for Microsoft Excel, called PHStat2, is included on the CD-ROM that accompanies the text. Make sure that the CD-ROM is included if you buy a used textbook. Since this is a new edition of the textbook, it is strongly 4 advised that you buy a new copy. Academic The Code of Academic Integrity of Villanova University addresses cheating, Integrity fabrication of submitted work, plagiarism, handing in work completed for Policy another course without the instructor’s approval, and other forms of dishonesty. For the first offense, a student who violates the Code of Villanova University will receive 0 (zero) points for the assignment. The violation will be reported by the instructor to the Dean’s Office and recorded in the student’s file. In addition, the student will be expected to complete an education program. For the second offense, the student will be dismissed from the University and the reason noted on the student’s official transcript. Business Statistics Course Outline Week Class Date Topics 1- 2 August 24 & 31 Descriptive Statistics 3-4 September 7 & 14 Basic Probability and Discrete Probability Distributions Chapte r Content 1,2,3 .. Organization of Data Measures of central tendency Measures of dispersion Shape of a distribution 4,5 Classical, relative frequency and subjective probabilities Sample spaces and events Contingency tables and Venn diagrams Simple marginal probability Joint probability General addition rule General multiplication rule and independence Conditional probability Bayes Theorem Counting methods (optional) Multiplication of choices Permutation Combination Probability distribution for a random variable Discrete probability distributions Expected value of a probability and its applications to business Standard deviation of a probability distribution and its applications to business Binomial distribution Poisson distribution (optional) 6 Introduction to Normal Distribution 7 Sampling and Sampling Distributions Central Limit Theorem (for sample mean) 5-6 September 21 September 28 Normal Distribution Sampling and 5 7 October 5 Sampling Distributions Estimation 8 Distribution for Sample Proportion Point estimate and interval estimate for a population parameter Confidence interval for a population mean or proportion The z-distribution The t-distribution Sample size for the population mean and population proportion Finite population correction factor 8 October 19 Hypothesis Testing 9 October 26 November 2&9 Midterm exam Hypothesis Testing 12 – 14 November 16 & 30 December 7 Simple and Multiple Regression Analysis 15 December 14 Final Exam 10 – 11 9 Type I and Type II error Test of single means and proportions and P values 9,10 12,13 Two sample tests of means and proportions Determination of sample size to control Type I and Type II error Simple regression analysis Correlation analysis Tests in simple regression Multiple regression analysis Problems in regression analysis 6


