Homework 1
advertisement
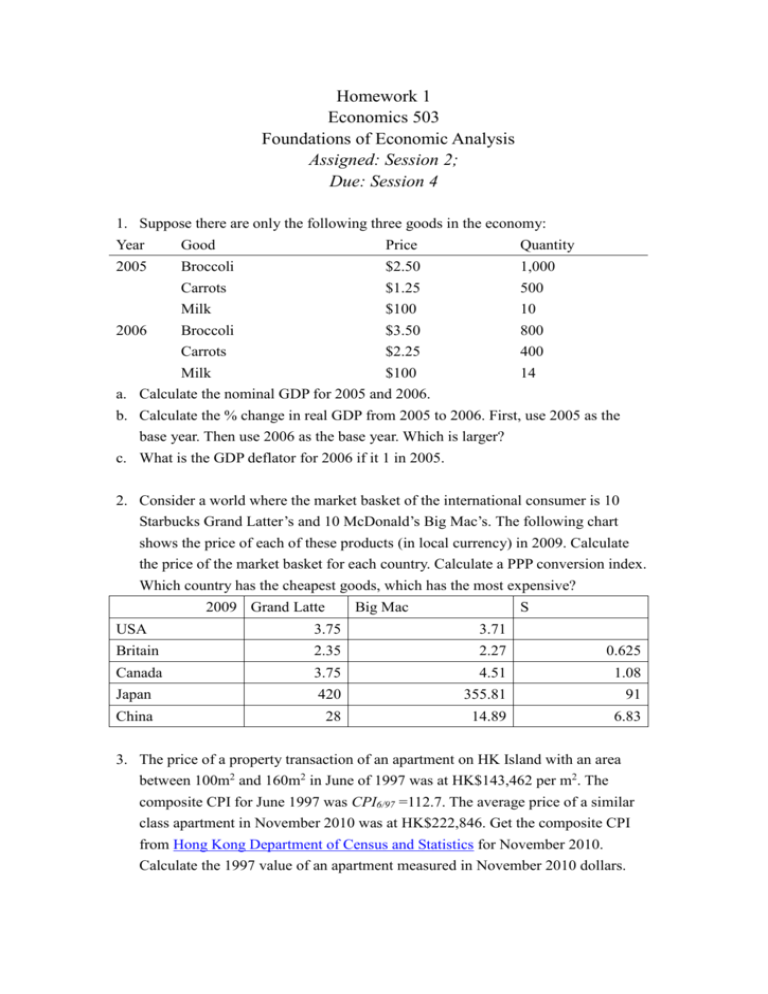
Homework 1 Economics 503 Foundations of Economic Analysis Assigned: Session 2; Due: Session 4 1. Suppose there are only the following three goods in the economy: Year Good Price Quantity 2005 Broccoli Carrots Milk $2.50 $1.25 $100 1,000 500 10 2006 Broccoli Carrots Milk $3.50 $2.25 $100 800 400 14 a. Calculate the nominal GDP for 2005 and 2006. b. Calculate the % change in real GDP from 2005 to 2006. First, use 2005 as the base year. Then use 2006 as the base year. Which is larger? c. What is the GDP deflator for 2006 if it 1 in 2005. 2. Consider a world where the market basket of the international consumer is 10 Starbucks Grand Latter’s and 10 McDonald’s Big Mac’s. The following chart shows the price of each of these products (in local currency) in 2009. Calculate the price of the market basket for each country. Calculate a PPP conversion index. Which country has the cheapest goods, which has the most expensive? 2009 Grand Latte Big Mac S USA 3.75 3.71 Britain 2.35 2.27 0.625 Canada 3.75 4.51 1.08 Japan 420 355.81 91 China 28 14.89 6.83 3. The price of a property transaction of an apartment on HK Island with an area between 100m2 and 160m2 in June of 1997 was at HK$143,462 per m2. The composite CPI for June 1997 was CPI6/97 =112.7. The average price of a similar class apartment in November 2010 was at HK$222,846. Get the composite CPI from Hong Kong Department of Census and Statistics for November 2010. Calculate the 1997 value of an apartment measured in November 2010 dollars. 4. Consider the following for a demand curve Price 11 10 9 8 7 6 5 4 3 Quantity 10 20 30 40 50 60 70 80 90 a. Use the midpoint formula to calculate the price elasticity between a price of $10 and $11. b. Use the midpoint formula to calculate the price elasticity between a price of $3 and $4. c. At what point is the total revenue maximized? What is the elasticity of demand if you raise the price $1 from that point? 5. Using the demand and supply diagrams (one for each market), show what short-run changes in price and quantity would be expected in the following markets if chemists develop a new cheaper method for making jet plane fuel. Each graph should contain the original and new demand and supply curve, and the original and new equilibrium prices and quantities. Fore each market, write one sentence explaining why each curve shifts or does not shift. a. The market for air travel. b. The market for rail travel. c. The market for suitcases. 6. Suppose the demand and supply curves for a product are given by QD 500 2 P QS 100 3P a. Find the equilibrium price and quantity. b. If the current price of the product is $100, what is the quantity supplied and the quantity demanded? How would you describe this situation and what would you expect to happen in this market? c. Suppose that demand changes to QD=600-2P. Find the new equilibrium price and quantity and show this on your graph.
