Introductory Macroeconomics Midterm Exam
advertisement
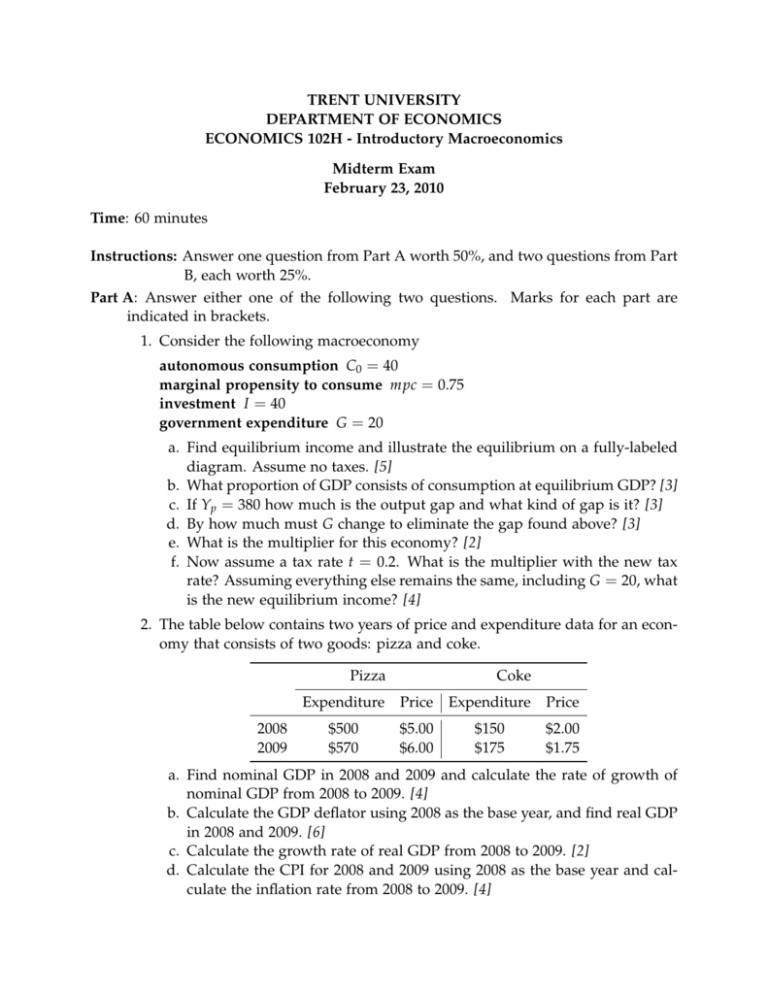
TRENT UNIVERSITY DEPARTMENT OF ECONOMICS ECONOMICS 102H - Introductory Macroeconomics Midterm Exam February 23, 2010 Time: 60 minutes Instructions: Answer one question from Part A worth 50%, and two questions from Part B, each worth 25%. Part A: Answer either one of the following two questions. Marks for each part are indicated in brackets. 1. Consider the following macroeconomy autonomous consumption C0 = 40 marginal propensity to consume mpc = 0.75 investment I = 40 government expenditure G = 20 a. Find equilibrium income and illustrate the equilibrium on a fully-labeled diagram. Assume no taxes. [5] b. What proportion of GDP consists of consumption at equilibrium GDP? [3] c. If Yp = 380 how much is the output gap and what kind of gap is it? [3] d. By how much must G change to eliminate the gap found above? [3] e. What is the multiplier for this economy? [2] f. Now assume a tax rate t = 0.2. What is the multiplier with the new tax rate? Assuming everything else remains the same, including G = 20, what is the new equilibrium income? [4] 2. The table below contains two years of price and expenditure data for an economy that consists of two goods: pizza and coke. Pizza 2008 2009 Coke Expenditure Price Expenditure Price $500 $570 $5.00 $6.00 $150 $175 $2.00 $1.75 a. Find nominal GDP in 2008 and 2009 and calculate the rate of growth of nominal GDP from 2008 to 2009. [4] b. Calculate the GDP deflator using 2008 as the base year, and find real GDP in 2008 and 2009. [6] c. Calculate the growth rate of real GDP from 2008 to 2009. [2] d. Calculate the CPI for 2008 and 2009 using 2008 as the base year and calculate the inflation rate from 2008 to 2009. [4] e. Compare the inflation rate calculated above using the CPI with the percentage increase in the price level measured by the GDP deflator. Why might they differ? [2] Part B: Answer any two (2) of the following four questions. Each question answered is worth 25%, and each part of a question is of equal value. 1. An economy has autonomous expenditures of $90 billion of which G = $30 billion, a marginal propensity to consume of 0.8 and a tax rate of 0.1. Potential output is $280 billion. Find: a. budget balance in this economy at equilibrium income b. the economy’s structural budget balance c. the level of Y at which the budget is balanced. Graph and label the budget balance function and identify these three budget balance points. Comment on the budget balance at equilibrium income relative to the structural budget balance. 2. Consider the following two transactions • You purchase a house from your brother for $425,000. He and his family have lived in it for a decade. • You purchase a house from a builder who completed construction this year for $425,000. What are the implications for GDP of each of the two transactions in the current year and why? 3. Explain the difference between movement along the AS curve and shifts in the AS curve. What causes movement along the AS curve and what does this movement represent? What causes the AS curve to shift? 4. Consider the following data collected from a country: Total population 1121 Population under 15 years of age or institutionalized 156 Retired persons 80 Homemakers 70 Unemployed 22 Part-time workers looking for full-time jobs 19 Full-time students ages 15 years and older 124 a. Calculate the size of the labour force. b. Calculate the unemployment rate. 2
