Unit III wksht 2
advertisement
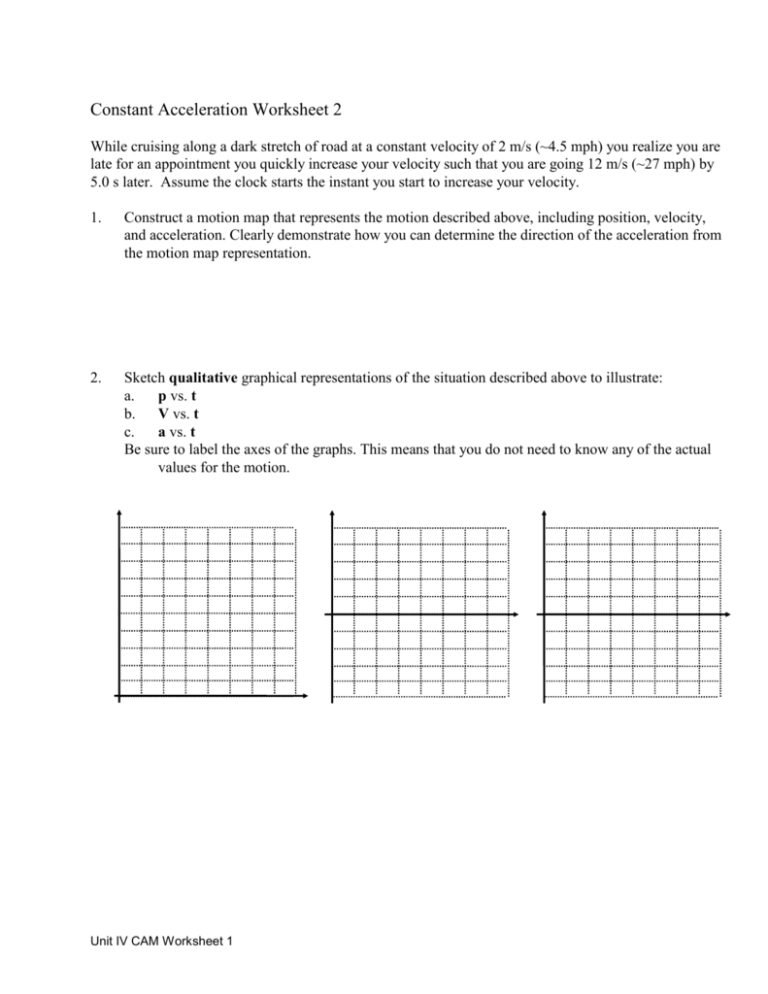
Constant Acceleration Worksheet 2 While cruising along a dark stretch of road at a constant velocity of 2 m/s (~4.5 mph) you realize you are late for an appointment you quickly increase your velocity such that you are going 12 m/s (~27 mph) by 5.0 s later. Assume the clock starts the instant you start to increase your velocity. 1. Construct a motion map that represents the motion described above, including position, velocity, and acceleration. Clearly demonstrate how you can determine the direction of the acceleration from the motion map representation. 2. Sketch qualitative graphical representations of the situation described above to illustrate: a. p vs. t b. V vs. t c. a vs. t Be sure to label the axes of the graphs. This means that you do not need to know any of the actual values for the motion. Unit IV CAM Worksheet 1 3. Construct quantitatively accurate graphical representations of the situation described above for: a) V vs. t b) a vs. t 4. On the V vs. t graph above, graphically represent your displacement. (i.e., what part of the velocity time graph tells you the displacement or how far you went). 5. Utilizing the graphical representation, determine how far the bike traveled. (Please explain your problem solving method or show the method in detail) 6. Did you, according to your graph, have a constant acceleration after you started to increase your velocity? Please explain how you know. 7. From the V vs. t graph, determine the acceleration once you started to increase your velocity. (Please show your work) 8. Using the equation of your curve determine how far you traveled during the time it was accelerating. (Show your work.) 9. To your amazement an Olympics track coach saw your amazing acceleration and signed you for the next Olympics track team! Unit IV CAM Worksheet 1 (adpated from Modeling Workshop Project) 2

