Full Report
PIC Wholesale Australian Share Fund
Fund Overview
About the Fund
Key Information
The Fund is designed to be a complete portfolio for the Australian shares asset
class, and aims to deliver growth by using investment managers who invest
and diversify across many companies listed on the Australian Securities
Exchange.
APIR Code MLC0768AU
Status Onsale
Product Size as at 31 May 2014
$74.86M
You can assess the performance of the Fund against the S&P/ASX 200
Accumulation Index over rolling 5 year periods.
Commencement Date
14 Mar 2007
Important Announcements
30 Jun 2013
Indicative Investment Fee
The Indicative Investment Fee shown in the Fund Overview is at a point in time and represents an annualised fee.
Consequently, the recent changes made to the Investment Fees will not be fully reflected in the Fund Profile Tool until
a) the data is refreshed in July 2013 and then
b) subsequent monthly recalculations occur (for the next 12 months).
Fund Breakdown
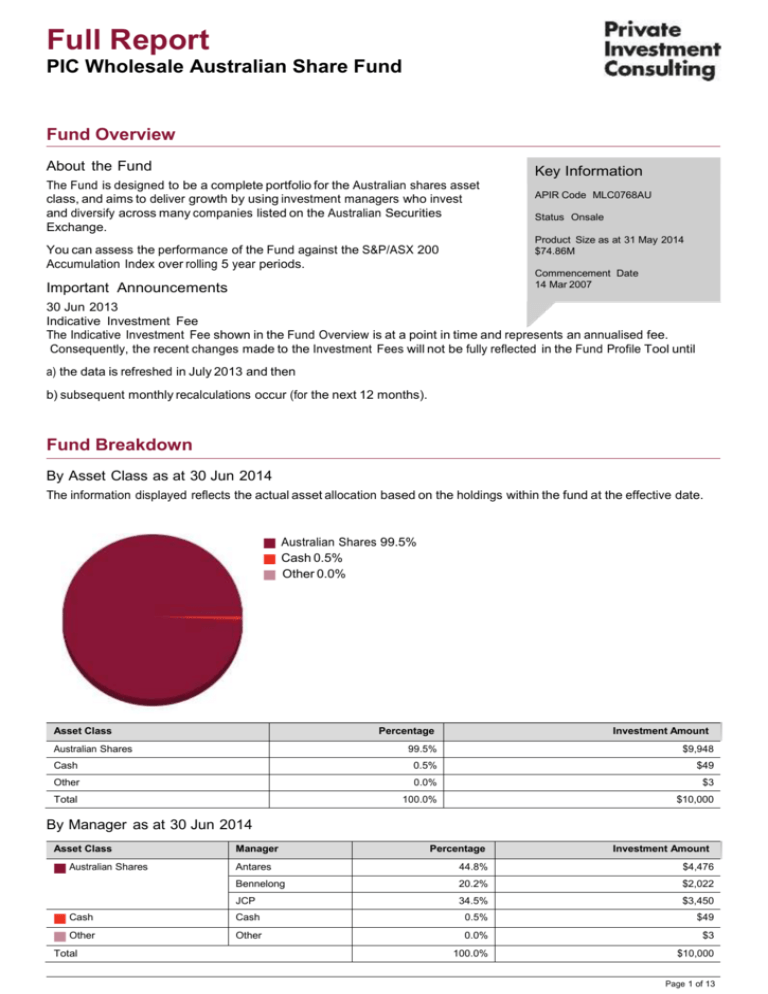
By Asset Class as at 30 Jun 2014
The information displayed reflects the actual asset allocation based on the holdings within the fund at the effective date.
Australian Shares 99.5%
Cash 0.5%
Other 0.0%
Asset Class
Percentage
Australian Shares
Investment Amount
99.5%
$9,948
Cash
0.5%
$49
Other
0.0%
$3
Total
100.0%
$10,000
By Manager as at 30 Jun 2014
Asset Class
Australian Shares
Manager
Percentage
Investment Amount
Antares
44.8%
$4,476
Bennelong
20.2%
$2,022
JCP
34.5%
$3,450
Cash
Cash
0.5%
$49
Other
Other
0.0%
$3
100.0%
$10,000
Total
Page 1 of 13
Full Report
PIC Wholesale Australian Share Fund
By Industry as at 30 Jun 2014
Financials 37.8%
Materials 15.6%
Energy 7.5%
Industrials 7.2%
Consumer Discretionary 6.7%
Telecommunication Services 6.5%
Health Care 5.6%
Industry
Consumer Staples 5.2%
Other 4.5%
Real Estate Investment Trusts (REITs) 1.6%
Utilities 1.0%
Information Technology 0.7%
Industrials 0.1%
Percentage
Investment Amount
Financials
37.8%
$3,781
Materials
15.6%
$1,564
Energy
7.5%
$750
Industrials
7.2%
$717
Consumer Discretionary
6.7%
$671
Telecommunication Services
6.5%
$650
Health Care
5.6%
$556
Consumer Staples
5.2%
$521
Other
4.5%
$448
Real Estate Investment Trusts (REITs)
1.6%
$165
Utilities
1.0%
$100
Information Technology
0.7%
$72
Industrials
0.1%
$5
100.0%
$10,000
Total
By Country as at 30 Jun 2014
Australasia 97.1%
North America 1.9%
United Kingdom 1.0%
Country
Australasia
North America
United Kingdom
Total
Percentage
Investment Amount
97.1%
$9,705
1.9%
$193
1.0%
$101
100.0%
$10,000
Page 2 of 13
Full Report
PIC Wholesale Australian Share Fund
Stock Holdings
Top Stocks for Fund as at 31 May 2014
The Top Stocks for Fund have a one month reporting delay.
Stock Description
Industry
Country
Percentage
Investment Amount
COMMONWEALTH BANK OF
AUSTRALIA
Financials
Australia
8.9%
$891
BHP BILLITON
Materials
Australia
8.1%
$812
WESTPAC BANKING CORP
Financials
Australia
7.1%
$706
TELSTRA CORP
Telecommunication Services
Australia
6.4%
$641
ANZ BANKING GROUP
Financials
Australia
6.2%
$622
NATIONAL AUSTRALIA BANK
Financials
Australia
4.6%
$462
SANTOS
Energy
Australia
3.0%
$302
CSL
Health Care
Australia
2.8%
$277
RIO TINTO
Materials
Australia
2.6%
$262
WESFARMERS
Consumer Staples
Australia
2.3%
$234
WESTFIELD GROUP
Real Estate Investment Trusts
(REITs)
Australia
2.3%
$229
QBE INSURANCE GROUP
Financials
Australia
2.3%
$226
MACQUARIE GROUP
Financials
Australia
2.2%
$223
AMP
Financials
Australia
2.2%
$222
STOCKLAND TRUST
Real Estate Investment Trusts
(REITs)
Australia
1.5%
$153
RAMSAY HEALTH CARE
Health Care
Australia
1.5%
$152
WOOLWORTHS LTD
Consumer Staples
Australia
1.5%
$151
CROWN RESORTS LIMITED
Consumer Discretionary
Australia
1.4%
$141
ORIGIN ENERGY
Energy
Australia
1.3%
$131
OIL SEARCH
Energy
Papua New
Guinea
1.3%
$129
Performance
Historical Performance
Absolute Fund Returns as at 30 Jun 2014
Returns for periods one year or greater are calculated on an annualised basis. All returns are calculated using end of
month redemption prices assuming all distributions are reinvested and are net of management fees which may include
administration fees, issuer fees and investment fees and prior to any individual tax considerations, and do not allow for
initial entry fees.
The returns outlined below represent historical performance only and is not an indication of future performance. The value
of an investment may rise or fall with changes in the market. Returns are calculated in accordance with FSC Standard No
6.
3 month
6 month
1 Year
3 Years
5 Years
10 Years
Since Inception
14 Mar 2007
Fund Performance
0.7%
2.1%
14.7%
8.9%
9.8%
N/A
2.3%
Growth
-2.3%
-1.3%
9.1%
4.1%
5.3%
N/A
-5.4%
Distribution
3.0%
3.5%
5.6%
4.7%
4.5%
N/A
7.7%
Page 3 of 13
Full Report
PIC Wholesale Australian Share Fund
For performance over a longer period, performance figures are provided for MLC Wholesale - MLC Wholesale Australian
Share Fund as at 30 Jun 2014
3 month
6 month
1 Year
3 Years
5 Years
10 Years
Since Inception
22 Jan 1998
Fund Performance
0.6%
2.0%
14.4%
8.6%
9.6%
7.9%
8.1%
Growth
-2.3%
-1.3%
9.1%
4.1%
5.3%
-1.9%
-0.1%
Distribution
2.9%
3.3%
5.4%
4.5%
4.2%
9.8%
8.2%
Page 4 of 13
Full Report
PIC Wholesale Australian Share Fund
Annual Distributions
Period
CPU
2013/2014
4.78
2012/2013
2.96
2011/2012
3.41
2010/2011
3.66
2009/2010
2008/2009
Franking Level
Assessable Income
Non-Assessable Income
68.1%
63.6
36.4
100.0%
98.1
1.9
90.7%
92.6
7.4
84.0%
95.4
4.6
2.69
91.4%
94.2
5.8
4.76
67.3%
65.4
34.6
2007/2008
15.99
21.6%
50.2
49.8
2006/2007
22.43
18.0%
60.9
39.1
2005/2006
27.89
14.6%
63.7
36.3
2004/2005
24.67
16.2%
55.6
44.4
2003/2004
4.13
66.8%
61.0
39.0
2002/2003
2.55
116.9%
96.9
3.1
Page 5 of 13
Full Report
PIC Wholesale Australian Share Fund
Page 6 of 13
Full Report
PIC Wholesale Australian Share Fund
Commentaries
Fund Commentary
As at 30 June 2014
The fund returned 0.8% (before fees and tax) in the quarter to 30 June. This was 0.1% below the 0.9% return of the
S&P/ASX200 Accumulation Index. Over the year to 30 June, the index returned 17.4% and the fund returned 15.2%
(before fees and tax), which was 2.2% below the index return.
The performance of the Australian market in the June quarter was modest compared to that of many overseas countries.
After recording positive returns in April (1.8%) and May (0.7%), the market fell 1.5% in June, its first negative monthly
return since January.
The sectors that weighed most heavily on the quarters subdued performance were Materials (-3.1%), Healthcare (-1.4%)
and Consumer Discretionary (-2.0%). In the Materials sector, falling prices for iron ore and other base metals meant share
prices of mining companies weakened (BHP Billiton -1.6%, Rio Tinto -6.7%, Fortescue Metals Group -17.1%). The
Healthcare sector lost ground due to the rising Australian dollar, which could impact the foreign earnings of some
Australian-based companies. The Consumer Discretionary sector was dented by a slump in consumer sentiment following
the Federal Budget and subsequent profit warnings by a number of retailers.
Real Estate Investment Trusts (REITs) was the best performing sector for the quarter, rising 9.2%. Sentiment towards the
sector was favourable during the quarter, with investors focussing on higher yielding segments of the market. The
passing of resolutions reorganising Westfield Group and Westfield Retail Trust into two new listed entities (Westfield
Corporation and Scentre Group), each with a clearer geographic and strategy focus, also assisted.
Other sectors that produced positive returns were Utilities (7.3%), Energy (5.1%), Telecommunications (1.7%) and
Financials ex-LPTs (1.2%).
In terms of stocks, the main contributors to the funds index-relative performance this quarter were:
an overweight position in Echo Entertainment Group Limited
not investing in Fortescue Metals Group Limited, and
an overweight position in Santos Limited.
The main detractors were:
an overweight holding in QBE Insurance Group Limited
an overweight position in Flight Centre Travel Group Limited, and
an overweight holding in Coca-Cola Amatil Limited.
In the year to 30 June, all sector returns were positive. Financials ex-LPTs recorded the highest return (21.9%) as
investors responded favourably to the earnings and dividend growth of the major banks. Resource-based sectors such
as Materials (18.1%) and Energy (18.3%) performed strongly, in contrast to much weaker performance over the few years
before that. Over the year, REITs was one of the worst-performing sectors (11.1%) due to a lower earnings growth profile
than other sectors. Most of REITS performance was in the June quarter.
In terms of stocks, the main contributors to the funds index-relative performance over the year were:
an overweight holding in Rio Tinto Limited
an underweight position in Woolworths Limited, and
not investing in Graincorp Limited.
The main detractors were:
an overweight position in QBE Insurance Group Limited
an overweight position in Coca-Cola Amatil Limited, and
an overweight position in ALS Limited.
Note:
- Please refer to the Market commentary for an overview of what happened in domestic and global markets over the
quarter.
- Fund commentary for this fund will be updated two to three weeks after the end of the month.
Page 7 of 13
Full Report
PIC Wholesale Australian Share Fund
Market Commentary
As at June 2014
Returns to 30 June 2014*
Asset class
3 mth (%)
1yr (%)
3yr (%)
5yr (%)
10yr (%)
Cash
0.7
2.7
3.6
3.9
5.0
Australian bonds
3.1
6.1
7.0
6.9
6.5
Global investment grade bonds (hedged)
2.6
7.8
7.9
8.4
7.8
A-REITs
9.3
11.1
15.3
14.3
2.3
Global REITs (hedged)
7.8
15.3
13.6
22.5
na
Australian shares
0.9
17.4
10.4
12.2
9.0
Global shares (hedged)
5.4
23.9
14.8
17.3
9.4
Global shares (unhedged)
3.3
19.9
15.6
11.4
4.8
Sources: Datastream, MLC Investment Management. *Annualised returns except for 3 month.
Benchnark data include UBS Bank Bill Index (Cash), UBS Composite Index (Aust bonds) Barclays Global Aggregate hedged to A$ (Global bonds),
S&P/ASX200 A-REIT Accumulation Index (A-REITs), MLC Global property strategy benchmark hedged to A$ (Global REITs), S&P/ASX200
Accumulation index (Aust shares) and MLC global equity strategy benchmark (MSCI All Country Indices hedged and unhedged in A$).
World share markets enjoyed good gains over the quarter, although a stronger Australian dollar did detract from
unhedged global share returns. While the Australian share market produced a positive return, it significantly
underperformed overseas markets, as mining stocks weakened in response to a falling iron ore price.
Bond yields fell in all the major world bond markets, producing solid gains for fixed income investors. Lower bond yields
also provided a boost to listed real estate securities around the globe. Australian real estate securities were the best
performing asset class for the quarter. In addition to lower bond yields, the sector benefitted from a takeover bid for the
Australand Group and news that shareholders had approved the restructure of Westfield.
Share prices have continued to rise, despite heightened geopolitical uncertainty. The crisis in the Ukraine is still
unresolved. More worryingly, Iraq, keeper of the worlds fifth largest oil reserves, is teetering on the brink of collapse, as
radical Islamist forces gain control of large swathes of Iraqi territory. Despite these developments, markets remained well
supported by an improving US economy, some better economic news from China, and the fact that monetary conditions
remain favourable for financial markets. During June, the European Central Bank took further steps to encourage bank
lending and economic growth. The Federal Reserve signalled that the unwinding of its quantitative easing program would
remain gradual, and that interest rates would remain extremely low for some time to come.
In Australia, the Federal Budget didnt appear to have any lasting impact on financial markets. While many individual
measures remain highly controversial, the budget is likely to exert only a modest drag on Australias economic growth over
the coming years. The Australian economic data released over the quarter were quite mixed. Australias economy
expanded at a faster than expected pace in the March quarter. Employment growth has improved, there are some signs of
a pick-up in investment outside of the mining industry, and private sector credit is still expanding. However, both business
and consumer confidence remain fragile, and investment in mining is expected to continue declining.
The Reserve Bank of Australia left interest rates unchanged over the quarter, and has signalled its intention to leave rates
unchanged for some time to come.
Page 8 of 13
Full Report
PIC Wholesale Australian Share Fund
MLC Investment Process
MLC Investment Philosophy
At MLC, we design investment portfolios based on the fundamental need of our investors; to grow and protect wealth for
the long term.
The core of any successful investment is a clear investment philosophy. Our investment philosophy defines the kind of
investor we are, and most importantly, how we manage your money in our diversified portfolios.
Our Investment Philosophy is:
We manage uncertainty about the future by considering many market environments
We are risk managers, not risk avoiders
We are responsible for all aspects of our portfolios
We can never be complacent.
Our approach to investing, the way we design, construct and implement our diversified portfolios is built around these
four key beliefs. Combined, these form the foundations of how we manage your money. Ultimately, we aim to deliver
more reliable returns in a broad range of market conditions.
Portfolio Design
At MLC we put you at the centre of our thinking and focus on what really makes an impact on investor outcomes: asset
allocation. With this in mind, we concentrate on finding the right allocations between asset classes and sub-asset classes
and design portfolios which help investors achieve their financial goals.
Formulating the portfolio
Firstly we consider the objectives of the portfolio and the level of volatility expected. We then look at the different classes
of assets and calculate how we expect them to perform over long periods of time. This helps us to formulate the asset
allocation for the portfolio because longer-term data is far more reliable for predicting the outcomes of asset classes.
To reduce risk we invest in many asset classes because they each perform differently in different circumstances. This
diversification also reduces volatility and leads to smoother returns for the overall portfolio.
Fine tuning the portfolio
We confirm the robustness of the portfolios asset allocation by stress-testing it in around 40 potential economic and
investment environments and against historical market performance data from the last 100 years. This allows us to
develop a clearer picture of how the portfolio will perform in different market conditions and provide investors with
portfolios which have already experienced a range of future outcomes. The process helps us with any fine tuning of the
portfolio to improve the outcome for clients.
Scenario insights and portfolio positioning
Our unique Investment Futures Framework helps us comprehensively assess what the future might hold and how risks
and opportunities may change over time. We use this information to adjust the investment strategy of our portfolios to
manage risk and capture opportunities for returns.
Page 9 of 13
Full Report
PIC Wholesale Australian Share Fund
Managing the Managers - Manager Selection
Finding the best businesses to invest in around the world is a specialist skill. We look for investment managers who can
demonstrate a sustainable competitive edge. We also ask our managers to build portfolios that reflect their best ideas.
Our approach to identifying exceptional investment managers involves:
maintaining a clear-cut view on what constitutes an exceptional investment manager e.g. a logical and robust
investment process applied through different market environments; the right people and experience to apply their
process.
meeting regularly with investment managers and individuals in the firm to get a better understanding of how the
investment manager operates, and
analysing the investment managers' portfolios to ensure they are investing the way they say they are.
Specialist managers
Our process typically results in the appointment of managers that specialise in a particular investment style or asset class,
rather than managers who favour an overall approach. The theory behind this is that it's easier to be good at one discipline
than a number of them.
Manager access
Through MLC, our investors can access investment managers who typically only deal with institutional investors. This
gives more access to a wider selection of the best managers in the world, not just those in Australia.
We look at past performance, we dont rely on it
When selecting managers, we look beyond brand and past performance. As markets move in cycles, certain market
conditions will suit different types of managers at different times. This means even the best managers will experience low
performance if market conditions dont suit their approach, and isn't a reason to terminate a manager.
Managing the Managers - Customised Mandates
We typically appoint investment managers who specialise in particular asset classes and investment styles, and assign
each one of them a specific mandate. This approach encourages them to focus on their areas of expertise and build a
portfolio of only their best or highest conviction ideas - companies the managers believe will provide better returns than
other companies and the market overall.
The benefits include:
Higher expected long-term after-tax returns from tailored high conviction portfolios
Insulation from transactions initiated by other investors within a larger investment pool, and
Transaction costs and capital gains tax are reduced both day-to-day and when manager changes occur.
Tax aware investing
Australia has different tax laws to the rest of the world. We select and assign mandates to investment managers we
believe can generate strong-after tax returns over the long term.
Unconstrained approach
We give our global managers the freedom to find the best investments anywhere in the world. This truly global
perspective ensures we make the most of our managers expertise for our investors.
Page 10 of 13
Full Report
PIC Wholesale Australian Share Fund
Managing the Managers - Manager Blending
Why blend managers?
We blend managers with different, but complementary, insights into investment markets. This diversification gives
managers the freedom to run with their convictions without having much impact on the overall risk of the portfolio.
And, by selecting only the best managers, who will each peak at different times, long-term returns shouldnt be diluted by
combining several different managers.
Determining each managers allocation
Each asset class strategy we design has a desired risk and return profile. This is used as the basis for determining the
appropriate combination of managers to achieve that profile.
Determining the allocation to each manager starts with our judgement based on intimate knowledge of each managers
investment approach. Data analysis is then used to test the proposed combinations.
Analysing manager portfolios
We use an analytical tool which contains details of every security in each managers portfolio and their characteristics. This
helps us to monitor the managers style and ensures theyre consistent with the strategys objective. We use this
information to confirm the combination of managers who best meet the objectives of the portfolios.
Portfolio Implementation
We have a team of investment professionals dedicated to portfolio implementation. Their key jobs include:
managing daily cash flows to ensure asset allocations and manager weights are kept in balance
managing transitions that result from strategy changes
structuring investment vehicles to facilitate efficient outcomes, and
ensuring the portfolio is implemented in a tax-efficient manner.
Rebalancing and managing cash flows
We apply a disciplined rebalancing approach to keep each portfolio within 2% of its target asset allocation. This means
investors can be confident the original characteristics of the portfolio are retained.
Reducing costs
Implementing changes within the portfolios will result in associated costs. However, our experience in transition
management helps us to keep these costs down so our investors returns are higher.
Ongoing Review
Ongoing research
We actively research asset classes and seek new opportunities to increase returns and reduce risk in our investments.
Manager review activities
We continuously review current and potential managers to ensure we have the best combination to manage our
portfolios.
Manager changes
Just as a sustainable competitive edge is what attracts us to a certain manager, the loss of this edge can lead to a
managers removal. Structural changes to our investment strategy may also lead to changes to the manager line-up.
Page 11 of 13
Full Report
PIC Wholesale Australian Share Fund
MLC's Multi-Manager Credentials
A market leader
Weve been providing multi-manager investment portfolios for more than 25 years. Rather than just delivering good returns
over a single period or timeframe, our strategies have consistently delivered strong peer-relative returns on an after-tax
and after-fees basis.
A history of innovation
We continually review and refine our investment solutions. This culture of innovation is driven by our determination to
design investment portfolios which help our investors achieve their financial goals.
Scale
Diversifying across a wide range of some of the worlds best investment managers and implementing the strategy
efficiently takes significant scale and resources. As at 31 March 2010 we had approximately A$50 billion funds under
management making us the largest multi-manager in Australia.
Who uses MLC?
Our investment process is used by some of Australias largest companies and by over one million Australians.
Page 12 of 13
Full Report
PIC Wholesale Australian Share Fund
Manager Profiles
Manages Australian cash, inflation-linked securities and nominal bonds, since 1991
Stable team of experienced investment professionals
Located in Sydney, Australia
Manages Australian shares for MLC, since 2011
Based in Sydney, Australia.
Manages Australian shares for MLC, since 2001
Origins dating back to 1998
50% owned by employees of the firm
The Other category includes currency positions, money that is transitioning between managers and securities that
have not been classified by asset class.
Information in this report does not take into account your objectives, financial situation or needs. Before acting on the information you should consider
whether it is appropriate to your situation. You should consider the relevant Product Disclosure Statement before making a decision about the product.
Past performance is not a reliable indicator of future performance. Please also see Advice Warning and Important Information.
MLC Limited (ABN 90 000 000 402 AFSL 230694) is the issuer of:
MLC MasterKey Investment Bond
MLC Nominees Pty Ltd (ABN 93 002 814 959 AFSL 230702 Trustee of The Universal Super Scheme ABN 44 928 361 101) is the issuer of:
MLC MasterKey Business Super (including MLC MasterKey Personal Super), MLC MasterKey Superannuation, MLC MasterKey Super, MLC MasterKey
Super Fundamentals, MLC MasterKey Allocated Pension, MLC MasterKey Pension, MLC MasterKey Pension Fundamentals, MLC MasterKey Term
Allocated Pension
MLC Investments Limited (ABN 30 002 641 661, AFSL number 230705) is the issuer or operator of:
MLC Investment Trust, MLC MasterKey Investment Service, MLC MasterKey Investment Service Fundamentals, MLC MasterKey Unit Trust, MLC
Investments Limited also trades as MLC Private Investment Consulting.
NULIS Nominees (Australia) Limited (ABN 80 008 515 633 AFSL 236465):
trustee of the MLCS Superannuation Trust ABN 31 919 182 354 is the issuer of Navigator Eligible Rollover Fund ABN 32 649 704 922;
trustee of the MLC Superannuation Fund ABN 40 022 701 955 is the issuer of MLC Wrap Super and MLC Navigator Retirement Plan.
Navigator Australia Limited (ABN 45 006 302 987 AFSL 236466) is the Operator and issuer of:
MLC Wrap Investments, MLC Wrap Self Managed Super and MLC Navigator Investment Plan.
© You are only authorised to use the data and content for the purpose of research, validation and monitoring of your personal investments. You may not
redistribute the data and content to any other person under any circumstances.
2013 Morningstar, Inc. All rights reserved. The data and content contained herein are not guaranteed to be accurate, complete or timely. Neither
Morningstar, nor its affiliates nor their content providers will have any liability for use or distribution of any of this information. To the extent that any of the
content above constitutes advice, it is general advice that has been prepared by Morningstar Australasia Pty Ltd ABN: 95 090 665 544, AFSL: 240892
(a subsidiary of Morningstar, Inc.), without reference to your objectives, financial situation or needs. Before acting on any advice, you should consider the
appropriateness of the advice and we recommend you obtain financial, legal and taxation advice before making any financial investment decision. If
applicable investors should obtain the relevant product disclosure statement and consider it before making any decision to invest. Some material is
copyright and published under licence from ASX Operations Pty Limited ACN 004 523 782 ("ASXO"). DISCLOSURE: Employees may have an interest in
the securities discussed in this report. Please refer to our Financial Services Guide (FSG) for more information at http://www.morningstar.com.au/fsg.asp
Page 13 of 13


