Brief Summary of Results (2.0 MB, doc)
advertisement

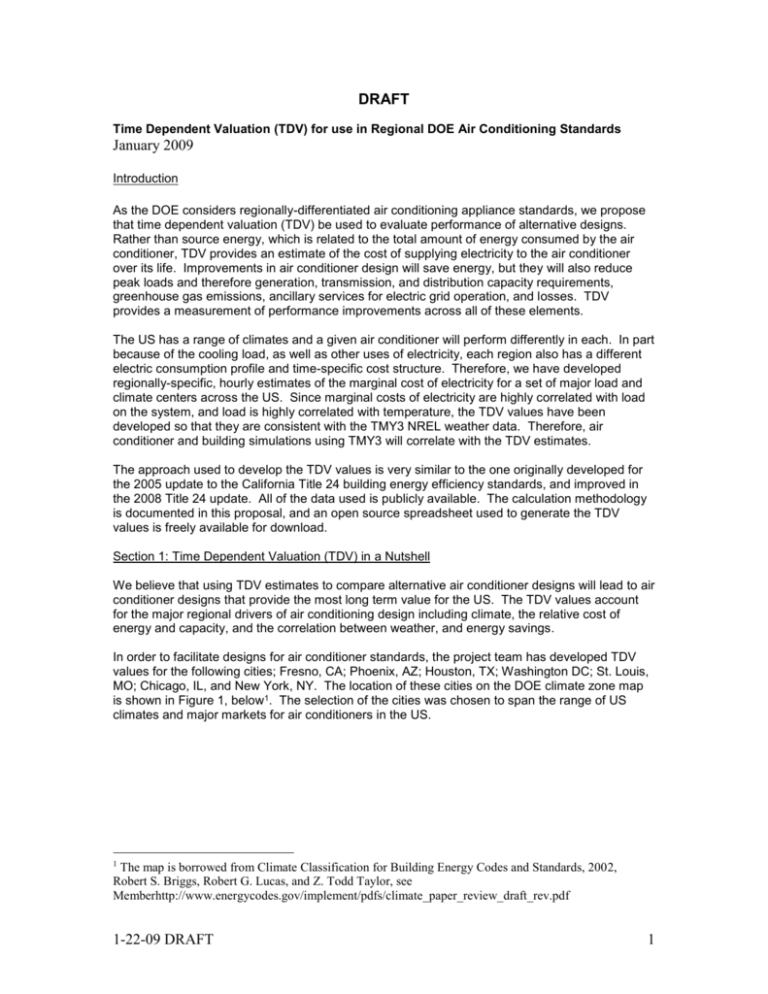
DRAFT Time Dependent Valuation (TDV) for use in Regional DOE Air Conditioning Standards January 2009 Introduction As the DOE considers regionally-differentiated air conditioning appliance standards, we propose that time dependent valuation (TDV) be used to evaluate performance of alternative designs. Rather than source energy, which is related to the total amount of energy consumed by the air conditioner, TDV provides an estimate of the cost of supplying electricity to the air conditioner over its life. Improvements in air conditioner design will save energy, but they will also reduce peak loads and therefore generation, transmission, and distribution capacity requirements, greenhouse gas emissions, ancillary services for electric grid operation, and losses. TDV provides a measurement of performance improvements across all of these elements. The US has a range of climates and a given air conditioner will perform differently in each. In part because of the cooling load, as well as other uses of electricity, each region also has a different electric consumption profile and time-specific cost structure. Therefore, we have developed regionally-specific, hourly estimates of the marginal cost of electricity for a set of major load and climate centers across the US. Since marginal costs of electricity are highly correlated with load on the system, and load is highly correlated with temperature, the TDV values have been developed so that they are consistent with the TMY3 NREL weather data. Therefore, air conditioner and building simulations using TMY3 will correlate with the TDV estimates. The approach used to develop the TDV values is very similar to the one originally developed for the 2005 update to the California Title 24 building energy efficiency standards, and improved in the 2008 Title 24 update. All of the data used is publicly available. The calculation methodology is documented in this proposal, and an open source spreadsheet used to generate the TDV values is freely available for download. Section 1: Time Dependent Valuation (TDV) in a Nutshell We believe that using TDV estimates to compare alternative air conditioner designs will lead to air conditioner designs that provide the most long term value for the US. The TDV values account for the major regional drivers of air conditioning design including climate, the relative cost of energy and capacity, and the correlation between weather, and energy savings. In order to facilitate designs for air conditioner standards, the project team has developed TDV values for the following cities; Fresno, CA; Phoenix, AZ; Houston, TX; Washington DC; St. Louis, MO; Chicago, IL, and New York, NY. The location of these cities on the DOE climate zone map is shown in Figure 1, below1. The selection of the cities was chosen to span the range of US climates and major markets for air conditioners in the US. 1 The map is borrowed from Climate Classification for Building Energy Codes and Standards, 2002, Robert S. Briggs, Robert G. Lucas, and Z. Todd Taylor, see Memberhttp://www.energycodes.gov/implement/pdfs/climate_paper_review_draft_rev.pdf 1-22-09 DRAFT 1 Chicago, IL Fresno, CA New York, NY St. Louis, MO Washington DC Phoenix, AZ Atlanta, GA Houston, TX Figure 1: Map of Locations Chosen for TDV For each of the locations, the major components of long-run marginal costs for electricity are estimated. The components that have been included, and a brief description of each, are provided in Table 1, below. Table 1: Components of the TDV Formulation Component Energy Losses Ancillary Services (A/S) System Capacity T&D Capacity Environment Description Estimate of hourly wholesale value of energy measured at the point of wholesale energy transaction Losses between the appliance location and the point of wholesale energy transaction The costs of providing system operations and reserves for electricity grid reliability The costs of building new generation capacity to meet system peak loads The costs of expanding transmission and distribution capacity to meet peak loads The costs of SOx, NOx, PM10, and CO2 associated with electricity production Figure 2, below, shows an example of the components of TDV for a week in the summer in Washington DC. As shown, the cost of providing an additional amount of electricity is significantly higher in the summer afternoons, than in the very early morning hours. This chart also shows the relative magnitude of different components in Chicago in the summer for during these days. 1-22-09 DRAFT 2 Figure 2: A 3 Day snapshot of TDV values in Washington DC TDV Value by Component for 3 Consecutive Days $600 $500 $400 $300 $200 $100 $- Mon, Jul 15 3 5 7 9 11 13 15 17 19 21 23 Tue, Jul 16 3 5 7 9 11 13 15 17 19 21 23 Wed, Jul 17 3 5 7 9 11 13 15 17 19 21 23 Levelized Value ($/MWh) $700 Hour Energy Losses A/S System Capacity T&D Capacity Environment Figure 3, below, shows the annual chronological set of estimated TDVs for Washington DC. There are a few high spikes, and seasonal increases and decreases over the course of the year. The spikes are caused by the costs of adding capacity to deliver electricity in the few highest load hours. For evaluation of regional air conditioning standards, the lifecycle change in costs across energy savings in many hours of the year will bring the average value of electricity savings well below the peaks. 1-22-09 DRAFT 3 Figure 3: Annual levelized TDV values for Washington DC ($/MWh in $2008) Annual Levelized TDV Value $/MWh Levelized TDV $/MWh ($2008) $2,000 $1,800 $1,600 T&D Capacity $1,400 System Capacity $1,200 A/S $1,000 Environment $800 Losses $600 Energy $400 $200 $0 1 1001 2001 3001 4001 5001 6001 7001 8001 Hour of the year The following chart shows the components of TDV value for the highest value hours in sorted order of cost. This chart shows the relative contribution to the highest hours of the year by component. Note that most of the high cost hours occur in approximately the top 200 to 400 hours. This is true in all regions in the US evaluated. Figure 4: TDV values by component in sorted order for Washington DC Price Duration Curve - All TDV Components $2,000 Levelized Total TDV Value ($/MWh) $1,800 $1,600 $1,400 T&D Capacity $1,200 System Capacity A/S $1,000 Environment $800 Losses $600 Energy $400 $200 $0 1 51 101 151 201 251 301 351 401 451 501 Top 500 Hours 1-22-09 DRAFT 4 Section 2: TDV Results for Select American Cities This section provides the chronological and sorted TDV results for each of the cities evaluated. Washington, D.C. Price Duration Curve - All TDV Components $2,000 Levelized Total TDV Value ($/MWh) $1,800 $1,600 $1,400 T&D Capacity $1,200 System Capacity A/S $1,000 Environment $800 Losses $600 Energy $400 $200 $0 1 51 101 151 201 251 301 351 401 451 501 Top 500 Hours Annual Levelized TDV Value $/MWh Levelized TDV $/MWh ($2008) $2,000 $1,800 $1,600 T&D Capacity $1,400 System Capacity $1,200 A/S $1,000 Environment $800 Losses $600 Energy $400 $200 $0 1 1001 2001 3001 4001 5001 6001 7001 8001 Hour of the year 1-22-09 DRAFT 5 Atlanta, GA Price Duration Curve - All TDV Components $2,500 Levelized Total TDV Value ($/MWh) $2,000 $1,500 T&D Capacity System Capacity A/S $1,000 Environment Losses $500 Energy $0 1 51 101 151 201 251 301 351 401 451 501 ($500) Top 500 Hours Annual Levelized TDV Value $/MWh Levelized TDV $/MWh ($2008) $2,500 $2,000 T&D Capacity $1,500 System Capacity A/S $1,000 Environment Losses $500 Energy $0 1 1001 2001 3001 4001 5001 6001 7001 8001 ($500) Hour of the year 1-22-09 DRAFT 6 Chicago, IL Price Duration Curve - All TDV Components Levelized Total TDV Value ($/MWh) $2,500 $2,000 T&D Capacity System Capacity $1,500 A/S Environment $1,000 Losses Energy $500 $0 1 51 101 151 201 251 301 351 401 451 501 Top 500 Hours Annual Levelized TDV Value $/MWh Levelized TDV $/MWh ($2008) $2,500 $2,000 T&D Capacity System Capacity $1,500 A/S Environment $1,000 Losses Energy $500 $0 1 1001 2001 3001 4001 5001 6001 7001 8001 Hour of the year 1-22-09 DRAFT 7 Fresno, CA Price Duration Curve - All TDV Components Levelized Total TDV Value ($/MWh) $2,500 $2,000 T&D Capacity System Capacity $1,500 A/S Environment $1,000 Losses Energy $500 $0 1 51 101 151 201 251 301 351 401 451 501 Top 500 Hours Annual Levelized TDV Value $/MWh Levelized TDV $/MWh ($2008) $2,500 $2,000 T&D Capacity System Capacity $1,500 A/S Environment $1,000 Losses Energy $500 $0 1 1001 2001 3001 4001 5001 6001 7001 8001 Hour of the year 1-22-09 DRAFT 8 Houston, TX Price Duration Curve - All TDV Components $2,000 Levelized Total TDV Value ($/MWh) $1,800 $1,600 $1,400 T&D Capacity $1,200 System Capacity A/S $1,000 Environment $800 Losses $600 Energy $400 $200 $0 1 51 101 151 201 251 301 351 401 451 501 Top 500 Hours Annual Levelized TDV Value $/MWh Levelized TDV $/MWh ($2008) $2,000 $1,800 $1,600 T&D Capacity $1,400 System Capacity $1,200 A/S $1,000 Environment $800 Losses $600 Energy $400 $200 $0 1 1001 2001 3001 4001 5001 6001 7001 8001 Hour of the year 1-22-09 DRAFT 9 New York, NY Price Duration Curve - All TDV Components $1,800 Levelized Total TDV Value ($/MWh) $1,600 $1,400 T&D Capacity $1,200 System Capacity $1,000 Energy $800 Losses A/S $600 Environment $400 $200 $0 1 51 101 151 201 251 301 351 401 451 501 Top 500 Hours Annual Levelized TDV Value $/MWh $1,800 Levelized TDV $/MWh ($2008) $1,600 $1,400 $1,200 T&D Capacity $1,000 System Capacity A/S $800 Environment $600 Losses $400 Energy $200 $0 ($200) 1 1001 2001 3001 4001 5001 6001 7001 8001 Hour of the year 1-22-09 DRAFT 10 Phoenix, AZ Price Duration Curve - All TDV Components Annual Levelized TDV Value $/MWh Levelized Total TDV Value ($/MWh) Levelized TDV $/MWh ($2008) $2,500 $60,000 $50,000 $2,000 $40,000 T&D Capacity T&D Capacity $30,000 $1,500 System System Capacity Energy A/S $20,000 Environment Losses $1,000 $10,000 Losses A/S Energy Environment $0 1 $500 ($10,000) 1001 2001 3001 4001 5001 6001 7001 8001 ($20,000) $0 1 51 101 151 Hour of the year 201 251 301 351 401 451 501 Top 500 Hours Annual Levelized TDV Value $/MWh Levelized TDV $/MWh ($2008) $2,500 $2,000 T&D Capacity System Capacity $1,500 A/S Environment $1,000 Losses Energy $500 $0 1 1001 2001 3001 4001 5001 6001 7001 8001 Hour of the year 1-22-09 DRAFT 11 St. Louis, MO Price Duration Curve - All TDV Components Levelized Total TDV Value ($/MWh) $3,000 $2,500 T&D Capacity $2,000 System Capacity A/S $1,500 Environment Losses $1,000 Energy $500 $0 1 51 101 151 201 251 301 351 401 451 501 Top 500 Hours Annual Levelized TDV Value $/MWh Levelized TDV $/MWh ($2008) $3,000 $2,500 $2,000 T&D Capacity System Capacity $1,500 A/S Environment $1,000 Losses Energy $500 $0 1 1001 2001 3001 4001 5001 6001 7001 8001 ($500) Hour of the year 1-22-09 DRAFT 12 Appendix 1: TDV framework and theoretical underpinnings [To be developed. Explanation of why TDV is the appropriate value methodology with academic references.] Appendix 2: Detailed TDV formulation [Details on TDV formulation.] Note to simulation modelers. The TDV values are correlated to the TMY 3 weather data. Appendix 3: Data references and sources This appendix provides links and references for all of the data used in the development of the TDV values, by data type. Natural gas forecast EIA. Annual Energy Outlook 2008. Table 19. http://www.eia.doe.gov/oiaf/aeo/pdf/0383(2008).pdf Power plant cost assumptions EIA. Annual Energy Outlook 2008. http://www.eia.doe.gov/oiaf/aeo/pdf/0383(2008).pdf California PUC. 2007 MPR Proceedings. http://www.cpuc.ca.gov/PUC/energy/electric/RenewableEnergy/faqs/04MarketPriceReferent.htm Cost of Emissions (SOx, NOx, PM-10, CO2): Evolution Markets. SO2 Monthly Market Update. July 2008. http://new.evomarkets.com/scripts/getmmu.php?uid=web&mmu_id=349 Evolution Markets. NOx Monthly Market Update. July 2008. http://new.evomarkets.com/scripts/getmmu.php?uid=web&mmu_id=350 System Loads and Local Loads Note: Please see “Utility and Weather Station Information” table below to see which utilities’ or zones’ loads were used for each city. Phoenix, Atlanta, St. Louis: FERC. Form 714. Please see table below to see which utilities’ loads were used for each city. http://www.ferc.gov/docs-filing/eforms/form-714/overview.asp DC, Chicago: PJM. Hourly load data. http://www.pjm.com/markets-and-operations/energy/real-time/loadhryr.aspx Fresno: CAISO. Hourly System Load. http://oasis.caiso.com/ 1-22-09 DRAFT 13 Houston: ERCOT. Hourly Load Data. http://www.ercot.com/gridinfo/load/load_hist/ New York: NYISO. Real time loads. http://www.nyiso.com/public/market_data/load_data/rt_actual_load.jsp Energy Prices Note: Please see “Utility and Weather Station Information” table below to see which utilities’ or zones’ energy prices were used for each city. Phoenix, Atlanta, St. Louis: FERC. Form 714. http://www.ferc.gov/docs-filing/eforms/form-714/overview.asp DC, Chicago: PJM. Day Ahead Hourly LMP. http://www.pjm.com/markets-and-operations/energy/day-ahead/lmpda.aspx Fresno: CAISO. Real time prices. http://oasis.caiso.com/ Houston: ERCOT. Balancing energy services market clearing prices. http://www.ercot.com/mktinfo/prices/mcpe New York: NYISO. Real time electricity prices. http://www.nyiso.com/public/market_data/pricing_data/rt_lbmp_zonal.jsp Weather Data Note: Please see “Utility and Weather Station Information” table below to see which weather stations’ data were used for each city. NOAA. Quality Controlled Local Climatological Data, Please see table below to see which stations were used for each city. NREL. Typical Meteorological Year 3. http://rredc.nrel.gov/solar/old_data/nsrdb/1991-2005/tmy3/ 1-22-09 DRAFT 14 Utility and Weather Station Information Phoenix Houston Atlanta DC NYC Energy Prices Load Local Area: Salt River Project Local Area: Salt River Project System: Arizona Public Service Local Area: ERCOT Coast Zone System: ERCOT Local Area: Georgia Power System: Southern Company Local Area: PEPCO System: Arizona Public Service Local Area: ERCOT Coast Zone System: ERCOT Local Area: Georgia Power System: Southern Company Local Area: PEPCO System: PJM MidAtlantic System: PJM MidAtlantic System: NYISO Local Area: NYC/Long Island System: NYISO Local Area: PG&E Local Area: PG&E System: CAISO System: CAISO Local Area: ComEd Local Area: ComEd System: PJM West System: PJM West Local Area: AmerenUE Local Area: Ameren UE System: AmerenUE + Ameren IL System: AmerenUE + Ameren IL Local Area: NYC Fresno Chicago St. Louis 1-22-09 DRAFT Temperature Data (Actual and TMY3) Phoenix Sky Harbor Intl Airport Houston Hobby Airport Atlanta Hartsfield Intl Airport Washington Reagan Airport New York Laguardia Airport Fresno Yosemite International Airport Chicago Midway Airport St Louis Lambert Airport 15


