AP Stats - Mrs. Badr's Class
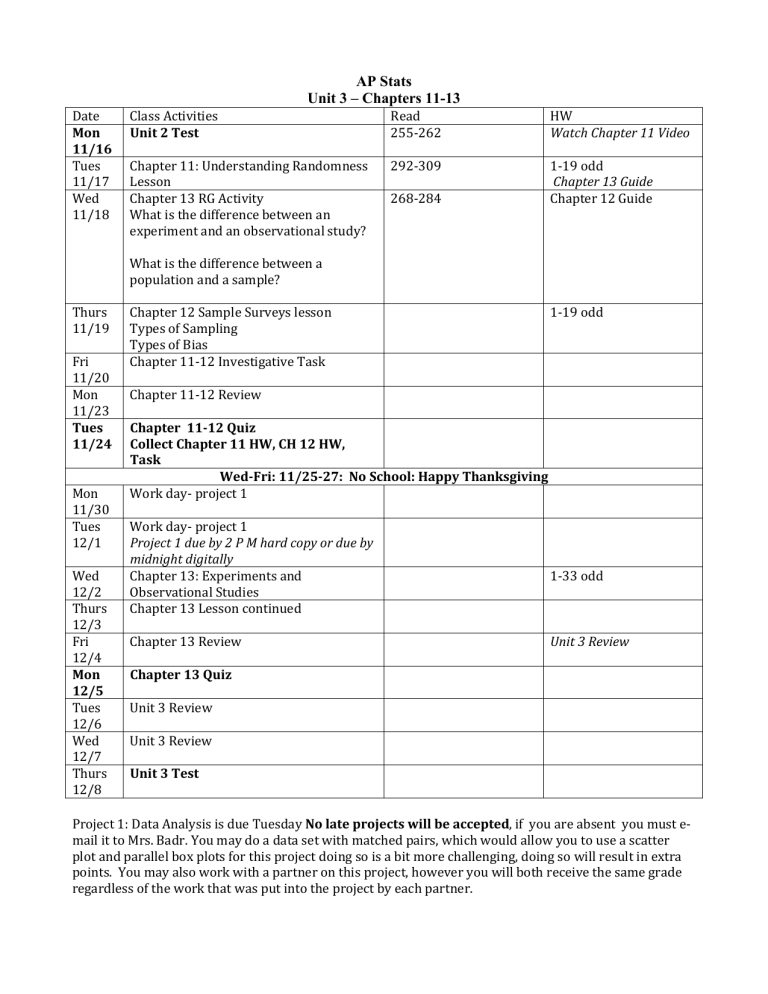
Date
Mon
11/16
Tues
11/17
Wed
11/18
Thurs
11/19
Class Activities
Unit 2 Test
AP Stats
Unit 3 – Chapters 11-13
Chapter 11: Understanding Randomness
Lesson
Chapter 13 RG Activity
What is the difference between an experiment and an observational study?
What is the difference between a population and a sample?
Chapter 12 Sample Surveys lesson
Types of Sampling
Types of Bias
Chapter 11-12 Investigative Task
Read
255-262
292-309
268-284
HW
Watch Chapter 11 Video
1-19 odd
Chapter 13 Guide
Chapter 12 Guide
1-19 odd
Fri
11/20
Mon
11/23
Tues
11/24
Chapter 11-12 Review
Chapter 11-12 Quiz
Collect Chapter 11 HW, CH 12 HW,
Task
Wed-Fri: 11/25-27: No School: Happy Thanksgiving
Work day- project 1 Mon
11/30
Tues
12/1
Wed
12/2
Thurs
12/3
Fri
12/4
Mon
12/5
Tues
12/6
Wed
12/7
Thurs
12/8
Work day- project 1
Project 1 due by 2 P M hard copy or due by
midnight digitally
Chapter 13: Experiments and
Observational Studies
Chapter 13 Lesson continued
Chapter 13 Review
Chapter 13 Quiz
Unit 3 Review
Unit 3 Review
Unit 3 Test
1-33 odd
Unit 3 Review
Project 1: Data Analysis is due Tuesday No late projects will be accepted, if you are absent you must email it to Mrs. Badr. You may do a data set with matched pairs, which would allow you to use a scatter plot and parallel box plots for this project doing so is a bit more challenging, doing so will result in extra points. You may also work with a partner on this project, however you will both receive the same grade regardless of the work that was put into the project by each partner.
Project 1: Data Analysis
The Purpose:
To practice describing data and graphs and to BEGIN to think about data collection and sources of bias
Tasks:
Collect at least 25 data points of your choosing – data must be quantitative
Graph your data
NEATLY by hand is fine – you can also choose to use MiniTab or Excel if you wish
Make THREE different types of graphs for the data – histogram, boxplot, stemplot and/or dotplot
Produce a one-page typed paper that includes the following:
1 st Paragraph
How and where you collected your data
2 nd Paragraph
Do you think your data represents the population you were studying? Why or why not?
What sources of bias do you think may have been present in your data collection?
3 rd Paragraph
By studying graphs of the data, what relationships can be observed?
What do the graphs show?
What conclusions can be drawn?
