Salinity Lab
advertisement
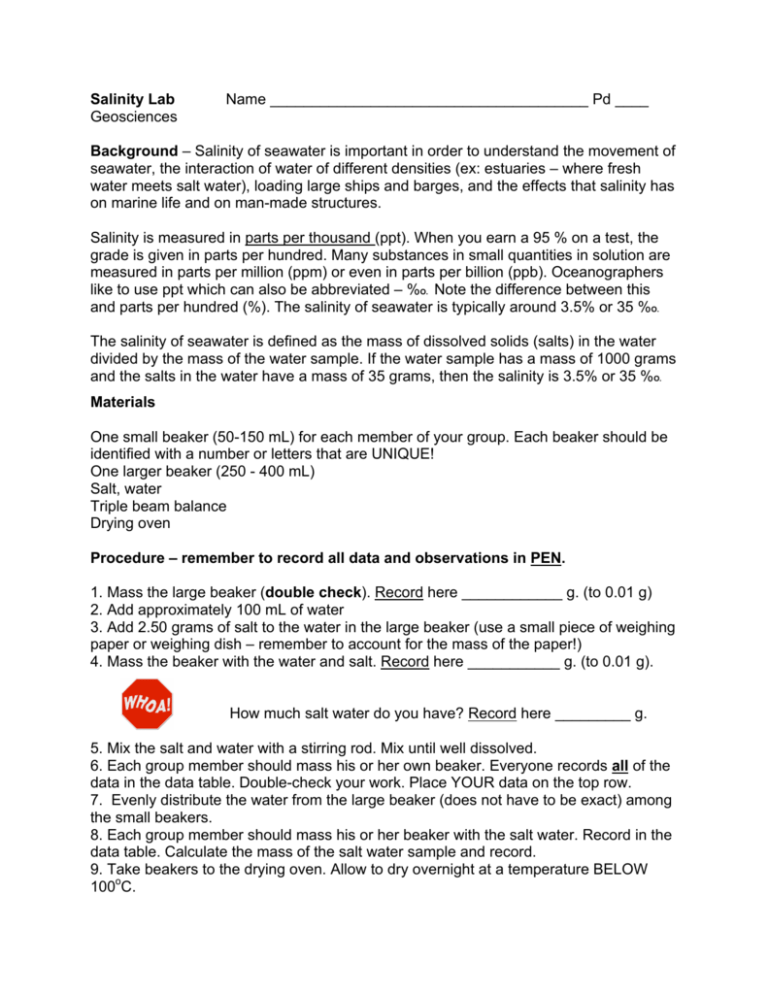
Salinity Lab Geosciences Name ______________________________________ Pd ____ Background – Salinity of seawater is important in order to understand the movement of seawater, the interaction of water of different densities (ex: estuaries – where fresh water meets salt water), loading large ships and barges, and the effects that salinity has on marine life and on man-made structures. Salinity is measured in parts per thousand (ppt). When you earn a 95 % on a test, the grade is given in parts per hundred. Many substances in small quantities in solution are measured in parts per million (ppm) or even in parts per billion (ppb). Oceanographers like to use ppt which can also be abbreviated – %O. Note the difference between this and parts per hundred (%). The salinity of seawater is typically around 3.5% or 35 %O. The salinity of seawater is defined as the mass of dissolved solids (salts) in the water divided by the mass of the water sample. If the water sample has a mass of 1000 grams and the salts in the water have a mass of 35 grams, then the salinity is 3.5% or 35 %O. Materials One small beaker (50-150 mL) for each member of your group. Each beaker should be identified with a number or letters that are UNIQUE! One larger beaker (250 - 400 mL) Salt, water Triple beam balance Drying oven Procedure – remember to record all data and observations in PEN. 1. Mass the large beaker (double check). Record here ____________ g. (to 0.01 g) 2. Add approximately 100 mL of water 3. Add 2.50 grams of salt to the water in the large beaker (use a small piece of weighing paper or weighing dish – remember to account for the mass of the paper!) 4. Mass the beaker with the water and salt. Record here ___________ g. (to 0.01 g). How much salt water do you have? Record here _________ g. 5. Mix the salt and water with a stirring rod. Mix until well dissolved. 6. Each group member should mass his or her own beaker. Everyone records all of the data in the data table. Double-check your work. Place YOUR data on the top row. 7. Evenly distribute the water from the large beaker (does not have to be exact) among the small beakers. 8. Each group member should mass his or her beaker with the salt water. Record in the data table. Calculate the mass of the salt water sample and record. 9. Take beakers to the drying oven. Allow to dry overnight at a temperature BELOW 100oC. STOP – allow beaker to be in oven overnight 10. CAUTION – be careful handling the beakers, they will be HOT! 11. Mass each of the small beakers that now contain only the salt. Record in data table. 12. Calculate the mass of the salt alone and record. (Column E) 13. Calculate the salinity of each sample by dividing the mass of the salt (column E) by the mass of the salt and water sample (column C) and record (Column F). 14. Calculate the expected salinity (divide 2.50 grams by the amount of salt water from #4). Record this salinity in column G. Remember to multiply by 1000. 15. Calculate the experimental error for each sample. I Expected value – Experimental value I Experimental error (%) = ----------------------------------------------------- x 100 Expected value Data and Observations (for use with small beakers only) A Student Name and Beaker ID Mass of beaker and salt water B Mass of beaker C Mass of salt water (A – B) D E Mass of beaker and salt Mass of the salt (D – B) F Salinity (E/C) x 1000 (ppt) G Expected salinity (ppt) H Experimental error (%) Questions – attach a separate page if needed (you’ll need it) 1. How might being on a ship make this method of finding the salinity difficult? 2. Experimental error within 15% is acceptable for this lab. What was your experimental error? How did you do? Where might the “errors” have occurred? 3. If a sample of the Dead Sea has a mass of 243.07 grams and the salt after evaporation has a mass of 50.82 grams, what is the salinity of the Dead Sea? How much more salt is in the Dead Sea compared to average ocean water? Twice? Three times? More? (Show ALL of your work!)

