Name Date CHEMICAL OCEANOGRAPHY LAB Background
advertisement
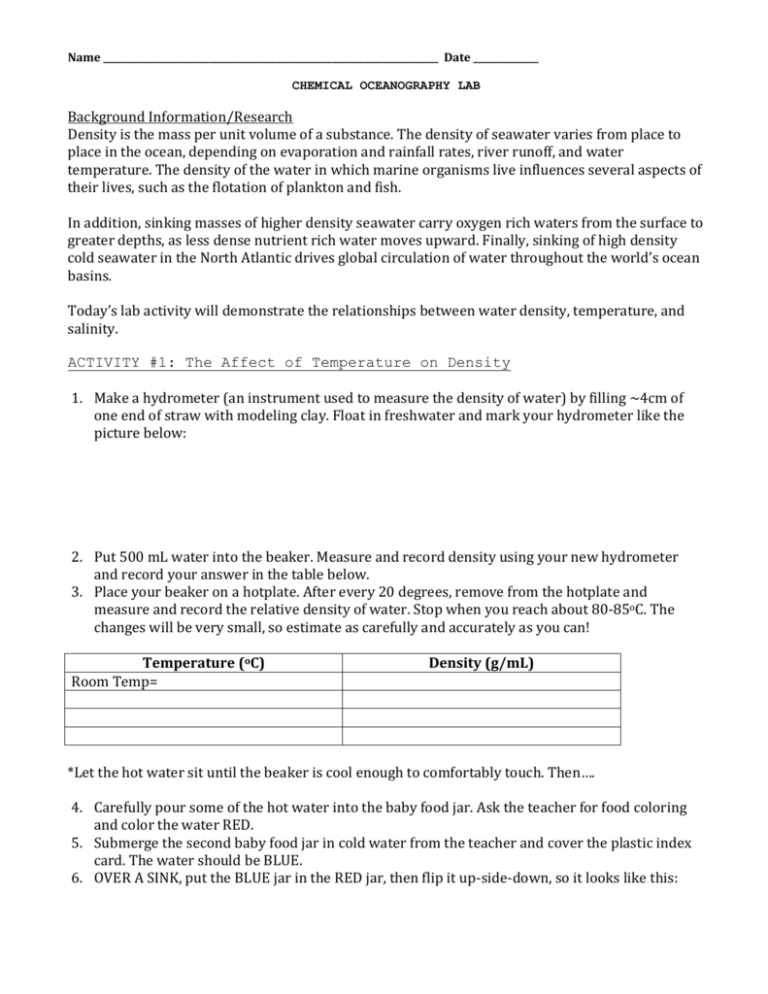
Name ________________________________________________________________________ Date ______________ CHEMICAL OCEANOGRAPHY LAB Background Information/Research Density is the mass per unit volume of a substance. The density of seawater varies from place to place in the ocean, depending on evaporation and rainfall rates, river runoff, and water temperature. The density of the water in which marine organisms live influences several aspects of their lives, such as the flotation of plankton and fish. In addition, sinking masses of higher density seawater carry oxygen rich waters from the surface to greater depths, as less dense nutrient rich water moves upward. Finally, sinking of high density cold seawater in the North Atlantic drives global circulation of water throughout the world’s ocean basins. Today’s lab activity will demonstrate the relationships between water density, temperature, and salinity. ACTIVITY #1: The Affect of Temperature on Density 1. Make a hydrometer (an instrument used to measure the density of water) by filling ~4cm of one end of straw with modeling clay. Float in freshwater and mark your hydrometer like the picture below: 2. Put 500 mL water into the beaker. Measure and record density using your new hydrometer and record your answer in the table below. 3. Place your beaker on a hotplate. After every 20 degrees, remove from the hotplate and measure and record the relative density of water. Stop when you reach about 80-85oC. The changes will be very small, so estimate as carefully and accurately as you can! Temperature (oC) Room Temp= Density (g/mL) *Let the hot water sit until the beaker is cool enough to comfortably touch. Then…. 4. Carefully pour some of the hot water into the baby food jar. Ask the teacher for food coloring and color the water RED. 5. Submerge the second baby food jar in cold water from the teacher and cover the plastic index card. The water should be BLUE. 6. OVER A SINK, put the BLUE jar in the RED jar, then flip it up-side-down, so it looks like this: 7. Pull out the card, observe and record your observations. 8. Carefully flip the jars over the so the BLUE water is on top. Observe and record observations. ANALYSIS QUESTIONS: a. What happens to the density of water as the temperature increases? ________________________ b. What do you think happens in the ocean where warm water currents from the tropics and cold water currents from the poles meet? Use examples from this activity to support your answer: ______________________________________________________________________________________________ ____________________________________________________________________________________________________________ ____________________________________________________________________________________________________________ ACTIVITY #2: The Effect of Salinity on Density 1. Pour 300mL of water into a beaker. Measure the density with your hydrometer and record your results in the table below. 2. Add and dissolve 10 grams of salt. Measure and record density in the table. 3. Dissolve as much salt in it as possible. When no more salt will dissolve, it is considered “saturated”. 4. Measure and record the density in the table. Trial # 1 2 3 Description of Salinity Density (g/mL) ANALYSIS QUESTIONS: a. What happens to the density of ocean water as more salt is added? ____________________________ b. Where would it be easiest to float: a lake, cold Atlantic Ocean, warm Caribbean Sea? Use the results from Activity 1 and 3 to explain your answer: ____________________________________________ _____________________________________________________________________________________________________________ _____________________________________________________________________________________________________________ _____________________________________________________________________________________________________________ ACTIVITY #3 (EXTENSION): Creating Ocean Layers Create your own ocean! You must create 4 water samples, each with a different salinity and temperature. (HINT: The more extreme the differences, the better your results will be!) Use what you know about temperature and salinity, as well as small scale (in a test tube) experimentations, to determine the order that our water samples will layer in. Water Sample/Color 1/ 2/ 3/ 4/ Salinity (cm on hydrometer) Temperature Hypothesis: Draw and label how you think your water samples will layer in each test tube: Procedure: 1. Carefully pour your water samples into a beaker, starting with what you think is the most dense. 2. Make observations. ANALYSIS QUESTIONS: a. Draw and label how your water samples actually layered? (Show true layers and any areas of mixing) b. Explain your result (why did you get the results you got?), using the terms density, temperature, and salinity. __________________________________________________________________________________________________________ __________________________________________________________________________________________________________ __________________________________________________________________________________________________________ __________________________________________________________________________________________________________ __________________________________________________________________________________________________________ __________________________________________________________________________________________________________
