table or chart - Teaching Tolerance
advertisement
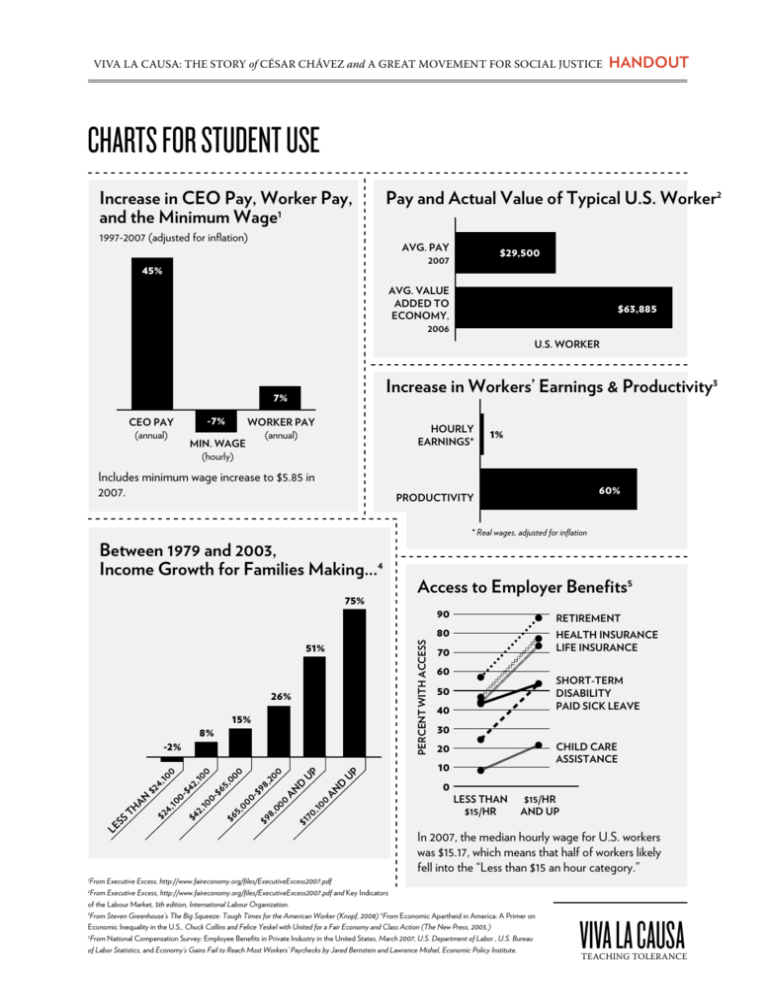
viva la causa: the story of césar chávez and a great movement for social Justice HANDOUT CHARTS FOR STUDENT USE Increase in CEO Pay, Worker Pay, and the Minimum Wage1 1997-2007 (adjusted for inflation) Pay and Actual Value of Typical U.S. Worker2 Avg. pay 2007 45% $29,500 avg. value added to economy, 2006 $63,885 U.S. Worker Increase in Workers’ Earnings & Productivity3 7% -7% CEO Pay (annual) min. wage (hourly) worker pay (annual) hourly earnings* Includes minimum wage increase to $5.85 in 2007. 1% 60% productivity * Real wages, adjusted for inflation Between 1979 and 2003, Income Growth for Families Making...4 51% 26% $6 5 up ,0 00 ,0 00 -$ 98 $9 ,2 8, 00 00 0 and $1 up 70 ,10 0 and 0 65 0$ 10 2, $4 10 0$ 42 ,10 10 0 4, $2 4, $2 than less 15% 8% -2% 90 percent with access 75% Access to Employer Benefits5 Retirement 80 Health insurance life insurance 70 60 short-term disability paid sick leave 50 40 30 child care assistance 20 10 0 Less than $15/hr $15/hr and up In 2007, the median hourly wage for U.S. workers was $15.17, which means that half of workers likely fell into the “Less than $15 an hour category.” From Executive Excess, http://www.faireconomy.org/files/ExecutiveExcess2007.pdf From Executive Excess, http://www.faireconomy.org/files/ExecutiveExcess2007.pdf and Key Indicators of the Labour Market, 5th edition, International Labour Organization. 3 From Steven Greenhouse’s The Big Squeeze: Tough Times for the American Worker (Knopf, 2008) 4From Economic Apartheid in America: A Primer on Economic Inequality in the U.S., Chuck Collins and Felice Yeskel with United for a Fair Economy and Class Action (The New Press, 2005.) 5 From National Compensation Survey: Employee Benefits in Private Industry in the United States, March 2007, U.S. Department of Labor , U.S. Bureau of Labor Statistics, and Economy’s Gains Fail to Reach Most Workers’ Paychecks by Jared Bernstein and Lawrence Mishel, Economic Policy Institute. 1 2 viva la causa Teaching Tolerance


![[ ] Monopsony (1)](http://s2.studylib.net/store/data/013219525_1-8caac2ebc0af2087a72ae6f25ab06b74-300x300.png)
