opinion & comment
CORRESPONDENCE:
Eliminating the local warming effect
To the Editor — Perceived deviations in
daily local temperatures can alter individuals’
views on global warming 1–6. Here, however,
I use an experiment to show that prompting
individuals to remember how the weather
felt over the past year severs the relationship
between perceptions of the daily temperature
with estimates of last year’s temperature
deviations and eliminates the ‘local warming
effect’. The results demonstrate the limits of
this effect and suggest ways to rhetorically
counteract it.
Zaval et al.6 show that when individuals
perceive the day’s local temperature to be
warmer than usual, they then overestimate
the number of warm days through the year,
which, in turn, leads them to increase their
stated belief in and concern about global
warming. Moreover, information about the
distinction between weather and climate, or
changes in terminology (for example, global
warming versus climate change) do not
counteract the impact of local temperatures
on beliefs. The size of the local warming
effect rivals the impact of age, race, and
education on global warming attitudes1.
Evidence for the local warming effect, as
it is often called5–6, is in line with literature
showing that people base survey responses
on whatever information most quickly
comes to mind7. The easy availability of
today’s temperature in memory triggers
people to then remember other warm days
in the past, overestimate the frequency of
warm days through the year, and increase
their belief in and concern about global
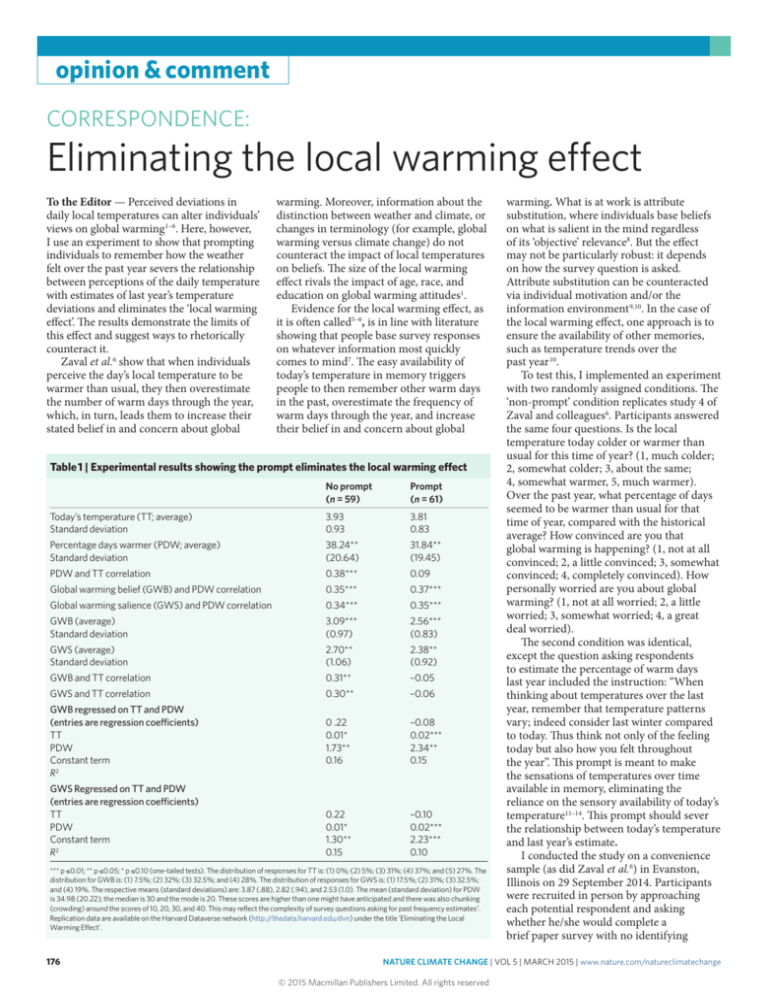
Table 1 | Experimental results showing the prompt eliminates the local warming effect
No prompt
(n = 59)
Prompt
(n = 61)
Today’s temperature (TT; average)
Standard deviation
3.93
0.93
3.81
0.83
Percentage days warmer (PDW; average)
Standard deviation
38.24**
(20.64)
31.84**
(19.45)
PDW and TT correlation
0.38***
0.09
Global warming belief (GWB) and PDW correlation
0.35***
0.37***
Global warming salience (GWS) and PDW correlation
0.34***
0.35***
GWB (average)
Standard deviation
3.09***
(0.97)
2.56***
(0.83)
GWS (average)
Standard deviation
2.70**
(1.06)
2.38**
(0.92)
GWB and TT correlation
0.31**
–0.05
GWS and TT correlation
0.30**
–0.06
GWB regressed on TT and PDW
(entries are regression coefficients)
TT
PDW
Constant term
R2
0 .22
0.01*
1.73**
0.16
–0.08
0.02***
2.34**
0.15
0.22
0.01*
1.30**
0.15
–0.10
0.02***
2.23***
0.10
GWS Regressed on TT and PDW
(entries are regression coefficients)
TT
PDW
Constant term
R2
*** p ≤0.01; ** p ≤0.05; * p ≤0.10 (one-tailed tests). The distribution of responses for TT is: (1) 0%; (2) 5%; (3) 31%; (4) 37%; and (5) 27%. The
distribution for GWB is: (1) 7.5%; (2) 32%; (3) 32.5%; and (4) 28%. The distribution of responses for GWS is: (1) 17.5%; (2) 31%; (3) 32.5%;
and (4) 19%. The respective means (standard deviations) are: 3.87 (.88), 2.82 (.94), and 2.53 (1.0). The mean (standard deviation) for PDW
is 34.98 (20.22); the median is 30 and the mode is 20. These scores are higher than one might have anticipated and there was also chunking
(crowding) around the scores of 10, 20, 30, and 40. This may reflect the complexity of survey questions asking for past frequency estimates7.
Replication data are available on the Harvard Dataverse network (http://thedata.harvard.edu/dvn) under the title ‘Eliminating the Local
Warming Effect’.
176
warming. What is at work is attribute
substitution, where individuals base beliefs
on what is salient in the mind regardless
of its ‘objective’ relevance8. But the effect
may not be particularly robust: it depends
on how the survey question is asked.
Attribute substitution can be counteracted
via individual motivation and/or the
information environment 9,10. In the case of
the local warming effect, one approach is to
ensure the availability of other memories,
such as temperature trends over the
past year 10.
To test this, I implemented an experiment
with two randomly assigned conditions. The
‘non-prompt’ condition replicates study 4 of
Zaval and colleagues6. Participants answered
the same four questions. Is the local
temperature today colder or warmer than
usual for this time of year? (1, much colder;
2, somewhat colder; 3, about the same;
4, somewhat warmer, 5, much warmer).
Over the past year, what percentage of days
seemed to be warmer than usual for that
time of year, compared with the historical
average? How convinced are you that
global warming is happening? (1, not at all
convinced; 2, a little convinced; 3, somewhat
convinced; 4, completely convinced). How
personally worried are you about global
warming? (1, not at all worried; 2, a little
worried; 3, somewhat worried; 4, a great
deal worried).
The second condition was identical,
except the question asking respondents
to estimate the percentage of warm days
last year included the instruction: “When
thinking about temperatures over the last
year, remember that temperature patterns
vary; indeed consider last winter compared
to today. Thus think not only of the feeling
today but also how you felt throughout
the year”. This prompt is meant to make
the sensations of temperatures over time
available in memory, eliminating the
reliance on the sensory availability of today’s
temperature11–14. This prompt should sever
the relationship between today’s temperature
and last year’s estimate.
I conducted the study on a convenience
sample (as did Zaval et al.6) in Evanston,
Illinois on 29 September 2014. Participants
were recruited in person by approaching
each potential respondent and asking
whether he/she would complete a
brief paper survey with no identifying
NATURE CLIMATE CHANGE | VOL 5 | MARCH 2015 | www.nature.com/natureclimatechange
© 2015 Macmillan Publishers Limited. All rights reserved
opinion & comment
information. As mentioned, participants
were randomly assigned to the non-prompt
or prompt condition. A prerequisite for
participation was that the individual had lived
in the area during the previous winter. The
temperature on the day of the study registered
a relatively high 80 °F, compared with a
normal high of 70 °F. The previous winter
was the coldest in the last 30 years and led to
a number of school closings, atypical for the
area. The use of a single sample/location on a
particular day has the advantage of ensuring
control over actual temperatures, thereby
offering a test for the conditions of the local
warming effect. Future work, however, should
explore the impact of different prompts with
distinct samples and locations where the daily
temperature is not clearly high.
I present the results in Table 1, with
a column for each condition. The first
row reveals that, not surprisingly given
the warmth of the day, the average for
both groups on the ‘today’s temperature’
(TT) question was near 4 on the scale. No
participants rated it as 1 and only six rated
it as 2. The next two rows reveal differences
in the percentage of warm days (PDW) last
year, and more importantly, the correlation
between PDW and TT. Today’s temperature
substantially correlates with past year’s
estimates for the non-prompt group (0.38) at
a level similar to that reported by Zaval et al.6.
This relationship does not exist in the
prompt group. The next two rows reveal
strong relationships between global warming
belief and concern with PDW, with similar
correlations for both groups.
As explained, PDW is higher in the
non-prompt group — because it is driven
by the high TT on that day — and the
consequence is higher belief and concern
scores. In other words, PDW drives beliefs
and concerns, regardless of the prompt, but
the prompt severs the connection that lead TT
to drive up PDW. The downstream effect of
the prompt is to vitiate global warming beliefs
and concern. The final four rows show that
TT correlates with beliefs and concern in the
non-prompt condition but not in the prompt
condition; and then, in multiple regressions,
PDW affects beliefs and concerns rather than
TT (even for the non-prompt condition).
The findings show that (1) without a prompt,
temperature on the day of survey shapes the
perceived number of warm days last year,
which in turn affects global warming beliefs
and concerns; and (2) with a prompt, this
temperature has no effect on the perceived
number of warm days last year. Perceived
number of warm days shapes global warming
beliefs and concerns, but beliefs and concerns
are not influenced by today’s temperature.
That PDW continues to have an influence
across conditions is intriguing, and may
suggest relatively salubrious processes
involved in opinion formation given that
perceptions of local weather trends tend to
be accurate15. The results indicate that science
communicators who are troubled by the
fleeting nature of the local warming effect2 can
counteract it with rhetoric that emphasizes
temperature deviations over time. Similarly,
when writing survey questions, researchers
might consider alternative phrasing that
minimizes the inadvertent usage of attribution
substitution processes13. In both cases, it
is unknown whether variables — such as
partisan identity and cultural worldview —
become increasingly impactful as the local
warming effect dissipates16.
❐
References
1. Egan, P. J. & Mullin, M. J. Politics 74, 796–809 (2012).
2. Egan, P. J. & Mullin, M. Nature Clim. Change 4, 89–90 (2014).
3. Krosnick, J. A., Holbrook, A. L., Lowe, L. & Visser. P. S.
Climatic Change 77, 7–43 (2006).
4. Semenza, J. C. et al. Am. J. Prev. Med. 35, 479–487 (2008).
5. Li, Y., Johnson, E. J. & Zaval. L. Psychol. Sci. 22, 454–450 (2011).
6. Zaval, L., Keenan, E. A., Johnson, E. J. & Weber, E. U.
Nature Clim. Change 4, 143–147 (2014).
7. Tourangeau, R., Rips, L. P. & Rasinski, K. The Psychology of Survey
Response (Cambridge Univ. Press, 2000).
8. Kahneman, D. & Frederick, S. in Heuristics and Biases: The Psychology
of Intuitive Judgment Representativeness Revisited: Attribute
Substitution in Intuitive Judgment (eds Gilovich, T., Griffin, D.
& Kahneman, D.) Ch. 2, 49–81 (Cambridge Univ. Press, 2002).
9. Druckman, J. N. Am. Polit. Sci. Rev. 98, 671–686 (2004).
10.Bless, H., Fiedler, K. & Stack, F. Social Cognition: How Individuals
Construct Reality (Taylor & Francis, 2004).
11.Graber, M. L. et al. BMJ Qual. Safety 21, 535–557 (2012).
12.Healy, A., Malhotra, N. & Mo, C. H. Proc. Natl Acad. Sci. USA
107, 12804–12809 (2010).
13.Healy, A. & Lenz, G. S. Am J. Polit. Sci. 58, 31–47 (2014).
14.Schwarz, N. & Clore, G. L. J. Pers. Soc. Psychol. 45, 513–523 (1983).
15.Howe, P. D., Markowtiz, E. M., Lee, T. M., Ko, C‑Y.
& Leiserowitz, A. Nature Clim. Change 3, 352–356 (2012).
16.Goebbert, K., Jenkins-Smith, H. C., Klockow, K. & Silva, C. L.
Weather Clim. Society 4, 132–144 (2012).
Acknowledgments
I thank Adam Howat, and Lisa Zaval for insightful advice.
James N. Druckman
Department of Political Science and Institute
for Policy Research, Northwestern University,
Scott Hall, 601 University Place, Evanston,
Illinois 60208, USA.
e-mail: druckman@northwestern.edu
COMMENTARY:
US climate policy needs
behavioural science
Amanda R. Carrico, Michael P. Vandenbergh, Paul C. Stern and Thomas Dietz
State implementation of new Environmental Protection Agency climate regulation may shift behavioural
strategies from sidelines to forefront of US climate policy.
I
n a rare move, the US Environmental
Protection Agency (EPA), in a new draft
rule known as ‘The Clean Power Plan’,
has signalled that it will allow states and
utilities to meet emissions standards by
reducing electricity demand. The details
of this regulation will have a substantial
impact on its effectiveness1, creating a
tremendous opportunity to put integrated,
multidisciplinary science to the practical
end of mitigating climate change. Huge
untapped potential exists for using
knowledge about how the public responds
to new technology, financial incentives
NATURE CLIMATE CHANGE | VOL 5 | MARCH 2015 | www.nature.com/natureclimatechange
© 2015 Macmillan Publishers Limited. All rights reserved
and regulations2. Financial incentives for
home weatherproofing, for example, have
varied tenfold in their impact on rates of
adoption, depending on a range of features
of programme implementation beyond the
financial incentives offered3. Incorporating
insights generated from such integrated
177


