NATIONAL PARTNERSHIP FOR QUALITY AFTERSCHOOL LEARNING
www.sedl.org/afterschool/toolkits
����������� �������� �������
Tutoring to Enhance Science Skills
Tutoring Two: Learning to Make Data Tables
..............................................................................................
Guidelines for Making a Data Table
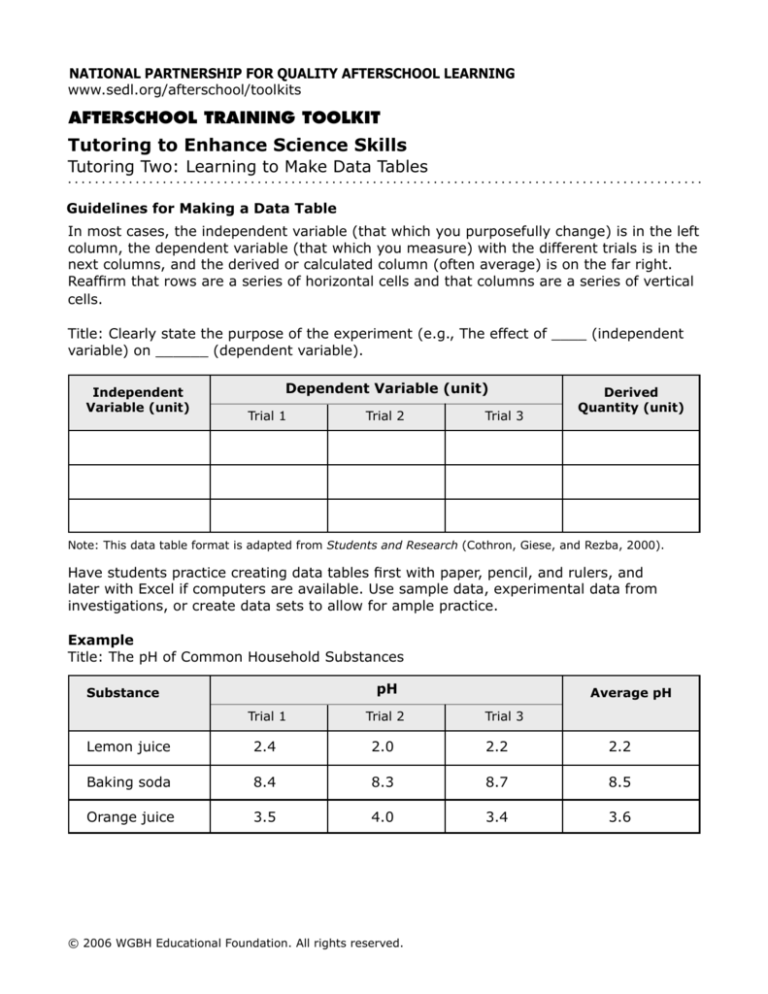
In most cases, the independent variable (that which you purposefully change) is in the left
column, the dependent variable (that which you measure) with the different trials is in the
next columns, and the derived or calculated column (often average) is on the far right.
Reaffirm that rows are a series of horizontal cells and that columns are a series of vertical
cells.
Title: Clearly state the purpose of the experiment (e.g., The effect of ____ (independent
variable) on ______ (dependent variable).
Independent
Variable (unit)
Dependent Variable (unit)
Trial 1
Trial 2
Trial 3
Derived
Quantity (unit)
Note: This data table format is adapted from Students and Research (Cothron, Giese, and Rezba, 2000).
Have students practice creating data tables first with paper, pencil, and rulers, and
later with Excel if computers are available. Use sample data, experimental data from
investigations, or create data sets to allow for ample practice.
Example
Title: The pH of Common Household Substances
pH
Substance
Average pH
Trial 1
Trial 2
Lemon juice
2.4
2.0
2.2
2.2
Baking soda
8.4
8.3
8.7
8.5
Orange juice
3.5
4.0
3.4
3.6
© 2006 WGBH Educational Foundation. All rights reserved.
Trial 3

