AP Statistics Summer Assignment: Vocabulary & Flashcards
advertisement
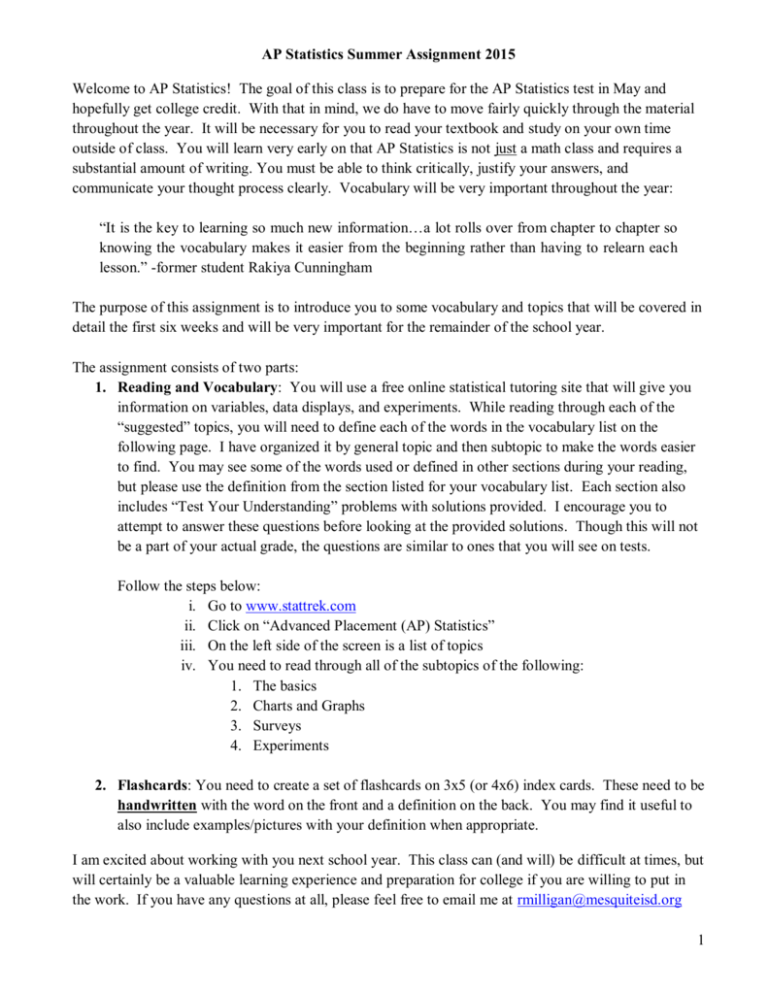
AP Statistics Summer Assignment 2015 Welcome to AP Statistics! The goal of this class is to prepare for the AP Statistics test in May and hopefully get college credit. With that in mind, we do have to move fairly quickly through the material throughout the year. It will be necessary for you to read your textbook and study on your own time outside of class. You will learn very early on that AP Statistics is not just a math class and requires a substantial amount of writing. You must be able to think critically, justify your answers, and communicate your thought process clearly. Vocabulary will be very important throughout the year: “It is the key to learning so much new information…a lot rolls over from chapter to chapter so knowing the vocabulary makes it easier from the beginning rather than having to relearn each lesson.” -former student Rakiya Cunningham The purpose of this assignment is to introduce you to some vocabulary and topics that will be covered in detail the first six weeks and will be very important for the remainder of the school year. The assignment consists of two parts: 1. Reading and Vocabulary: You will use a free online statistical tutoring site that will give you information on variables, data displays, and experiments. While reading through each of the “suggested” topics, you will need to define each of the words in the vocabulary list on the following page. I have organized it by general topic and then subtopic to make the words easier to find. You may see some of the words used or defined in other sections during your reading, but please use the definition from the section listed for your vocabulary list. Each section also includes “Test Your Understanding” problems with solutions provided. I encourage you to attempt to answer these questions before looking at the provided solutions. Though this will not be a part of your actual grade, the questions are similar to ones that you will see on tests. Follow the steps below: i. Go to www.stattrek.com ii. Click on “Advanced Placement (AP) Statistics” iii. On the left side of the screen is a list of topics iv. You need to read through all of the subtopics of the following: 1. The basics 2. Charts and Graphs 3. Surveys 4. Experiments 2. Flashcards: You need to create a set of flashcards on 3x5 (or 4x6) index cards. These need to be handwritten with the word on the front and a definition on the back. You may find it useful to also include examples/pictures with your definition when appropriate. I am excited about working with you next school year. This class can (and will) be difficult at times, but will certainly be a valuable learning experience and preparation for college if you are willing to put in the work. If you have any questions at all, please feel free to email me at rmilligan@mesquiteisd.org 1 Exploring Data Vocabulary The Basics Variables Variable Categorical Quantitative Discrete Continuous Population vs Sample Central Tendency Population Sample Parameter Statistic μ and 𝑥 Median Mean Variability Position Range Interquartile Range (ignore alt. def.) Variance Standard deviation Percentile Quartile Standard score (include formula) Charts and Graphs Patterns in data (include a sketch) Comparing data sets Symmetry Unimodal Bimodal Bell-shaped Center Spread Shape Unusual Features Skewness Uniform Gap Outliers Planning a Study Vocabulary Surveys Data Collection Sampling Methods Bias in Surveys Census Sample survey Experiment Observational study Convenience sample Stratified sampling Systematic sampling Bias Representative Under coverage Nonresponse Voluntary response Response bias Voluntary sample Simple random sampling Cluster sampling Multi-stage sampling Experiments Intro to experiments Factor Level Treatment Experimental unit/subject Three characteristics of a well-designed experiment Control group Placebo Placebo effect Blinding Double blinding Lurking variables Confounding 2
