Lesson
4 Visualizing Fractions
Problem Solving:
Pictographs
Visualizing Fractions
Vocabulary
What are different ways to show fractions?
fair share
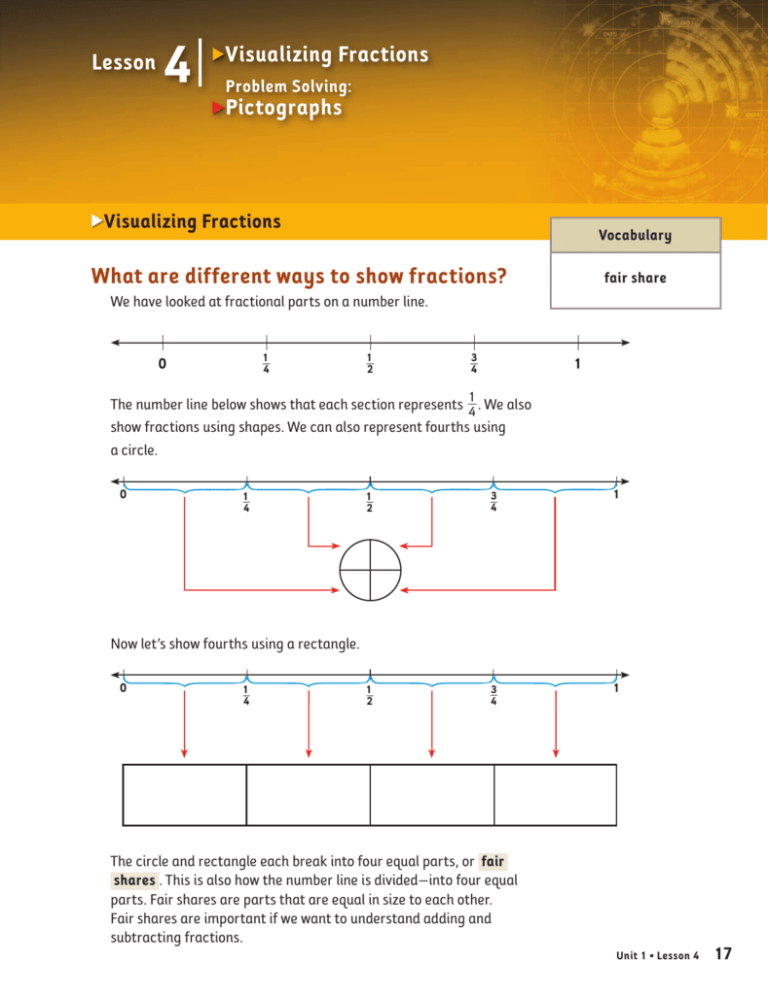
We have looked at fractional parts on a number line.
1
4
0
1
2
3
4
1
The number line below shows that each section represents 1
4 . We also
show fractions using shapes. We can also represent fourths using
a circle.
0
3
1
1
4
2
4
1
Now let’s show fourths using a rectangle.
0
3
1
1
4
2
4
The circle and rectangle each break into four equal parts, or fair
shares . This is also how the number line is divided—into four equal
parts. Fair shares are parts that are equal in size to each other.
Fair shares are important if we want to understand adding and
subtracting fractions.
1
Unit 1 • Lesson 4 17
Lesson 4
Does the shape matter when dividing
fractional parts?
We can use any number of shapes to show fractions divided into fair
shares. Here are some shapes that are broken into fractional parts.
Each shape is divided into parts, and each part is the same size.
Circles
Halves
Thirds
Fourths
Squares
Halves
The most important
thing to see is that each
fractional part in the
shape is a fair share.
Thirds
Fourths
Hexagons
Halves
Thirds
Fourths
Improve Your Skills
A common mistake we can make when we first learn about fractions
is to misread a fractional part when the shape does not divide
equally. Look at the shapes below and choose the ones that are
divided into equal fractional parts, or fair shares.
A
B
C
D
Shape A correctly shows halves, but B does not.
Shape C correctly shows thirds, but D does not.
18 Apply Skills
Reinforce Understanding
Turn to Interactive Text,
page 11.
Use the mBook Study Guide
to review lesson concepts.
Unit 1 • Lesson 4
We cannot call something
a fractional part if it does
not divide the shape into
fair shares.
Lesson 4
Problem Solving: Pictographs
Vocabulary
What are pictographs?
pictograph
Pictographs are like bar graphs, but they use pictures to represent
the data. The pictures have a connection to the data. Pictographs
help us view data visually, but they are not very exact. They can only
give us a general view of the data.
A company wants to show how much flour it sold from January through
May. It could record the data using a pictograph like the one shown in
Example 1.
Example 1
Show how much flour was sold using a pictograph.
Flour Sold
Tons of Flour Sold (in millions)
4
FLOUR
3
FLOUR
FLOUR
2
FLOUR
FLOUR
FLOUR
FLOUR
Jan.
Feb.
FLOUR
FLOUR
FLOUR
FLOUR
FLOUR
Mar.
Apr.
May
1
0
Month
The graph shows about how much flour was sold each month. The
pictures for April show three whole bags and one bag of flour cut in half.
This means that the company sold 3 1
2 million tons of flour. Pictographs
are useful when we want to communicate a general idea about the data.
Problem-Solving Activity
Reinforce Understanding
Turn to Interactive Text,
page 12.
Use the mBook Study Guide
to review lesson concepts.
Unit 1 • Lesson 4 19
Lesson 4
Homework
Activity 1
Draw the shapes and divide them into fractional parts.
1. Divide the circle into halves. 2. Divide the rectangle into fourths. 3. Divide the triangle into thirds. 4. Divide the square into fourths. Activity 2
Look at the shapes. Which ones show fair shares? (a)
(b)
(g)
(c)
(h)
(d)
(e)
(j)
(i)
(f)
(k)
(l)
Activity 3 • Distributed Practice
Solve.
1.
497
+ 286
783
20 Unit 1 • Lesson 4
2.
4,007
1,928
2,079
3.
67
39
2,613
4.
591
4
5. 9q678
2,364
Copyright 2010 by Cambium Learning Sopris West®. All rights reserved. Permission is granted to reproduce this page for student use.


