Lesson Plan - Mr-Mathematics.com
advertisement
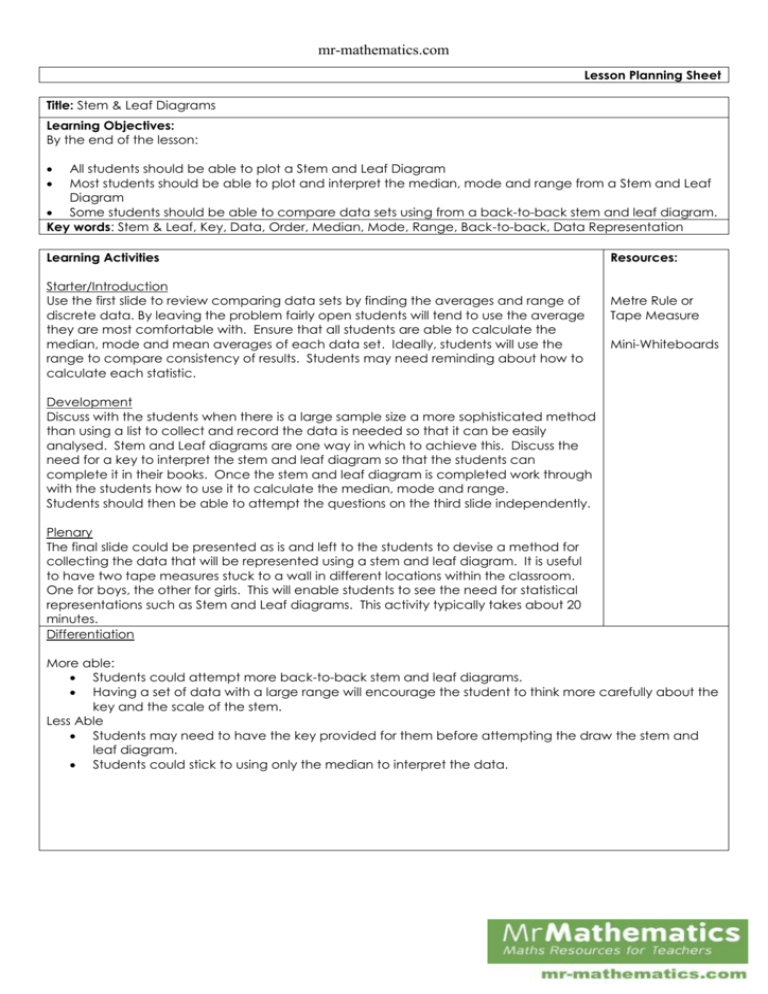
mr-mathematics.com Lesson Planning Sheet Title: Stem & Leaf Diagrams Learning Objectives: By the end of the lesson: All students should be able to plot a Stem and Leaf Diagram Most students should be able to plot and interpret the median, mode and range from a Stem and Leaf Diagram Some students should be able to compare data sets using from a back-to-back stem and leaf diagram. Key words: Stem & Leaf, Key, Data, Order, Median, Mode, Range, Back-to-back, Data Representation Learning Activities Starter/Introduction Use the first slide to review comparing data sets by finding the averages and range of discrete data. By leaving the problem fairly open students will tend to use the average they are most comfortable with. Ensure that all students are able to calculate the median, mode and mean averages of each data set. Ideally, students will use the range to compare consistency of results. Students may need reminding about how to calculate each statistic. Resources: Metre Rule or Tape Measure Mini-Whiteboards Development Discuss with the students when there is a large sample size a more sophisticated method than using a list to collect and record the data is needed so that it can be easily analysed. Stem and Leaf diagrams are one way in which to achieve this. Discuss the need for a key to interpret the stem and leaf diagram so that the students can complete it in their books. Once the stem and leaf diagram is completed work through with the students how to use it to calculate the median, mode and range. Students should then be able to attempt the questions on the third slide independently. Plenary The final slide could be presented as is and left to the students to devise a method for collecting the data that will be represented using a stem and leaf diagram. It is useful to have two tape measures stuck to a wall in different locations within the classroom. One for boys, the other for girls. This will enable students to see the need for statistical representations such as Stem and Leaf diagrams. This activity typically takes about 20 minutes. Differentiation More able: Students could attempt more back-to-back stem and leaf diagrams. Having a set of data with a large range will encourage the student to think more carefully about the key and the scale of the stem. Less Able Students may need to have the key provided for them before attempting the draw the stem and leaf diagram. Students could stick to using only the median to interpret the data.

