Guide to Data Analysis
advertisement
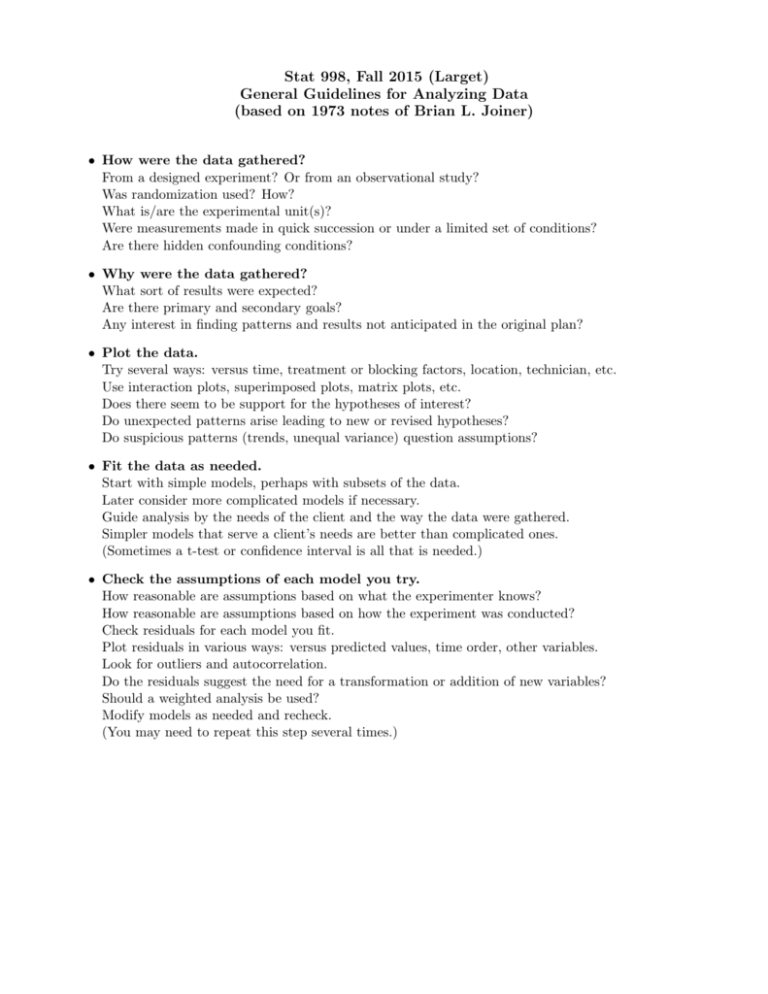
Stat 998, Fall 2015 (Larget) General Guidelines for Analyzing Data (based on 1973 notes of Brian L. Joiner) • How were the data gathered? From a designed experiment? Or from an observational study? Was randomization used? How? What is/are the experimental unit(s)? Were measurements made in quick succession or under a limited set of conditions? Are there hidden confounding conditions? • Why were the data gathered? What sort of results were expected? Are there primary and secondary goals? Any interest in finding patterns and results not anticipated in the original plan? • Plot the data. Try several ways: versus time, treatment or blocking factors, location, technician, etc. Use interaction plots, superimposed plots, matrix plots, etc. Does there seem to be support for the hypotheses of interest? Do unexpected patterns arise leading to new or revised hypotheses? Do suspicious patterns (trends, unequal variance) question assumptions? • Fit the data as needed. Start with simple models, perhaps with subsets of the data. Later consider more complicated models if necessary. Guide analysis by the needs of the client and the way the data were gathered. Simpler models that serve a client’s needs are better than complicated ones. (Sometimes a t-test or confidence interval is all that is needed.) • Check the assumptions of each model you try. How reasonable are assumptions based on what the experimenter knows? How reasonable are assumptions based on how the experiment was conducted? Check residuals for each model you fit. Plot residuals in various ways: versus predicted values, time order, other variables. Look for outliers and autocorrelation. Do the residuals suggest the need for a transformation or addition of new variables? Should a weighted analysis be used? Modify models as needed and recheck. (You may need to repeat this step several times.) Things not to do when writing consulting reports (Larget, Fall 2015) 1. Do not use inappropriate statistical models. • The model you choose to use should match the design of the experiment. • There is not a single correct or best model, but there are many inappropriate ones. • In particular, when data is grouped, do not ignore this grouping! 2. Do not summarize hypothesis tests with fixed significance level testing. • The theory supporting tests with fixed α is useful for proving theorems about long-run average rates of successful decision making. • The scientist wants to know the strength of evidence from data about certain key questions. • Report p-values and how you determined them for tests of interest. • Better, include estimates of model parameters or other quantities with estimates of uncertainty in the context of the measured variables and scientific questions. 3. Do not include raw computer output. • You are writing a report to a client, not submitting homework to a statistics professor (at least pretend for report writing). • Most raw computer output contains many more details than the client needs to see. • Space is at a premium; do not waste it. • Your job is to interpret the output and communicate the important stuff to the client. 4. Do not include irrelevant or poorly made graphs. • Every graph in a report should support something meaningful you wish to communicate. • Every graph should be clearly labeled, annotated, and easy to read. • If the report is in black and white, use an appropriate graph for this choice. • Take the time to make graphs presentation worthy. 5. Do not use excessive technical jargon. • Your job is to communicate the results to the scientist. • Assume that someone reading the report will not have substantial statistical knowledge. • Explain what you can in plain and clear language. • You cannot avoid technical language completely, but minimize it. A well written report will include: • a concise summary of primary results that is correct and appropriate and addresses the key questions; • clear and plain language; • well-constructed meaningful graphics; • sufficient detail for a knowledgable reader to duplicate your analysis without too much detail to harm communication with the scientist.
