April 23: Petroleum Capital and Operating Costs: What Can
advertisement
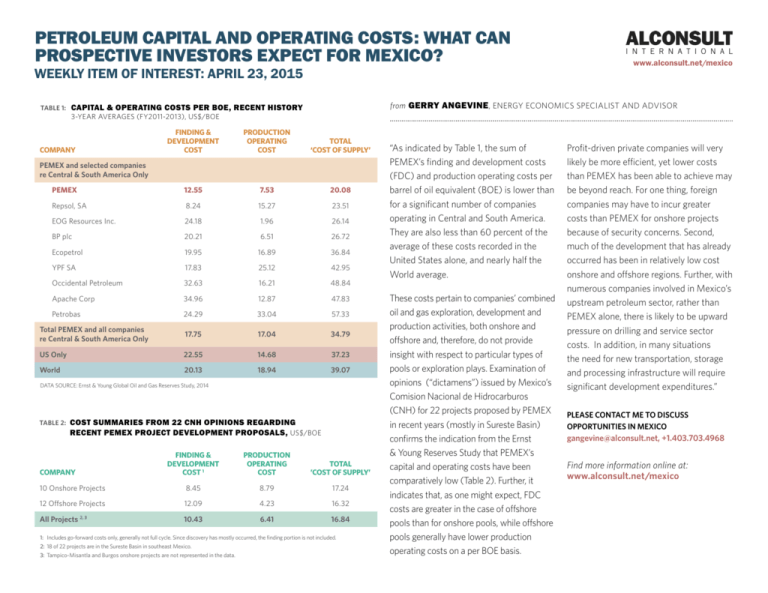
PETROLEUM CAPITAL AND OPERATING COSTS: WHAT CAN PROSPECTIVE INVESTORS EXPECT FOR MEXICO? WEEKLY ITEM OF INTEREST: APRIL 23, 2015 TABLE 1: from GERRY ANGEVINE , ENERGY ECONOMICS SPECIALIST AND ADVISOR CAPITAL & OPERATING COSTS PER BOE, RECENT HISTORY 3-YEAR AVERAGES (FY2011-2013), US$/BOE FINDING & DEVELOPMENT COST PRODUCTION OPERATING COST TOTAL ‘COST OF SUPPLY’ PEMEX 12.55 7.53 20.08 Repsol, SA 8.24 15.27 23.51 EOG Resources Inc. 24.18 1.96 26.14 BP plc 20.21 6.51 26.72 Ecopetrol 19.95 16.89 36.84 YPF SA 17.83 25.12 42.95 Occidental Petroleum 32.63 16.21 48.84 Apache Corp 34.96 12.87 47.83 Petrobas 24.29 33.04 57.33 Total PEMEX and all companies re Central & South America Only 17.75 17.04 34.79 US Only 22.55 14.68 37.23 World 20.13 18.94 39.07 COMPANY PEMEX and selected companies re Central & South America Only DATA SOURCE: Ernst & Young Global Oil and Gas Reserves Study, 2014 TABLE 2: www.alconsult.net/mexico COST SUMMARIES FROM 22 CNH OPINIONS REGARDING RECENT PEMEX PROJECT DEVELOPMENT PROPOSALS, US$/BOE FINDING & DEVELOPMENT COST 1 PRODUCTION OPERATING COST TOTAL ’COST OF SUPPLY’ 10 Onshore Projects 8.45 8.79 17.24 12 Offshore Projects 12.09 4.23 16.32 All Projects 10.43 6.41 16.84 COMPANY 2, 3 1: Includes go-forward costs only, generally not full cycle. Since discovery has mostly occurred, the finding portion is not included. 2: 18 of 22 projects are in the Sureste Basin in southeast Mexico. 3: Tampico-Misantla and Burgos onshore projects are not represented in the data. “As indicated by Table 1, the sum of PEMEX’s finding and development costs (FDC) and production operating costs per barrel of oil equivalent (BOE) is lower than for a significant number of companies operating in Central and South America. They are also less than 60 percent of the average of these costs recorded in the United States alone, and nearly half the World average. These costs pertain to companies’ combined oil and gas exploration, development and production activities, both onshore and offshore and, therefore, do not provide insight with respect to particular types of pools or exploration plays. Examination of opinions (“dictamens”) issued by Mexico’s Comision Nacional de Hidrocarburos (CNH) for 22 projects proposed by PEMEX in recent years (mostly in Sureste Basin) confirms the indication from the Ernst & Young Reserves Study that PEMEX’s capital and operating costs have been comparatively low (Table 2). Further, it indicates that, as one might expect, FDC costs are greater in the case of offshore pools than for onshore pools, while offshore pools generally have lower production operating costs on a per BOE basis. Profit-driven private companies will very likely be more efficient, yet lower costs than PEMEX has been able to achieve may be beyond reach. For one thing, foreign companies may have to incur greater costs than PEMEX for onshore projects because of security concerns. Second, much of the development that has already occurred has been in relatively low cost onshore and offshore regions. Further, with numerous companies involved in Mexico’s upstream petroleum sector, rather than PEMEX alone, there is likely to be upward pressure on drilling and service sector costs. In addition, in many situations the need for new transportation, storage and processing infrastructure will require significant development expenditures.” PLEASE CONTACT ME TO DISCUSS OPPORTUNITIES IN MEXICO gangevine@alconsult.net, +1.403.703.4968 Find more information online at: www.alconsult.net/mexico
