Fundamentals of Fixed Income
In Australia, fixed income as a
defensive asset class has not normally
received as much attention as its
equity counterpart, owing in part to
the strong returns exhibited in the
equity market in the five year growth
period between 2002 and 2007, and
in part due to limitations in accessing
the asset class. However, the onset
Global Financial Crisis (GFC) in 2007
and the subsequent share market
volatility refocused thinking toward
fixed income as an asset class, and
the role it could play in achieving
investment objectives.
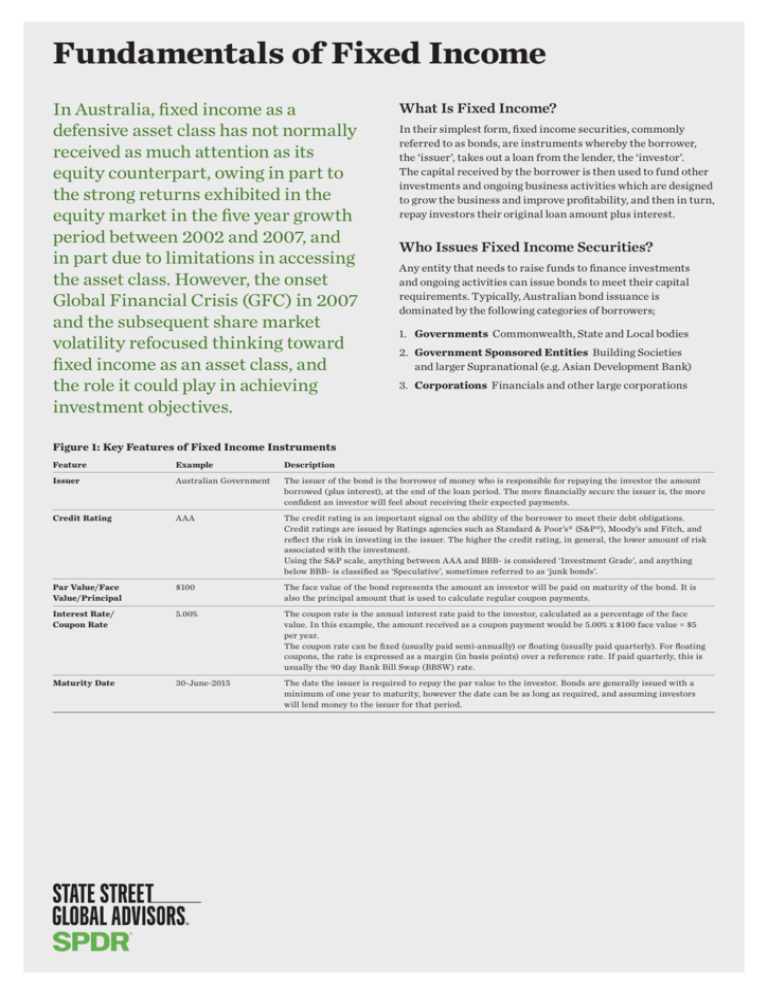
What Is Fixed Income?
In their simplest form, fixed income securities, commonly
referred to as bonds, are instruments whereby the borrower,
the ‘issuer’, takes out a loan from the lender, the ‘investor’.
The capital received by the borrower is then used to fund other
investments and ongoing business activities which are designed
to grow the business and improve profitability, and then in turn,
repay investors their original loan amount plus interest.
Who Issues Fixed Income Securities?
Any entity that needs to raise funds to finance investments
and ongoing activities can issue bonds to meet their capital
requirements. Typically, Australian bond issuance is
dominated by the following categories of borrowers;
1. Governments Commonwealth, State and Local bodies
2. Government Sponsored Entities Building Societies
and larger Supranational (e.g. Asian Development Bank)
3. Corporations Financials and other large corporations
Figure 1: Key Features of Fixed Income Instruments
Feature
Example
Description
Issuer
Australian Government
The issuer of the bond is the borrower of money who is responsible for repaying the investor the amount
borrowed (plus interest), at the end of the loan period. The more financially secure the issuer is, the more
confident an investor will feel about receiving their expected payments.
Credit Rating
AAA
The credit rating is an important signal on the ability of the borrower to meet their debt obligations.
Credit ratings are issued by Ratings agencies such as Standard & Poor’s® (S&P®), Moody’s and Fitch, and
reflect the risk in investing in the issuer. The higher the credit rating, in general, the lower amount of risk
associated with the investment.
Using the S&P scale, anything between AAA and BBB- is considered ‘Investment Grade’, and anything
below BBB- is classified as ‘Speculative’, sometimes referred to as ‘junk bonds’.
Par Value/Face
Value/Principal
$100
The face value of the bond represents the amount an investor will be paid on maturity of the bond. It is
also the principal amount that is used to calculate regular coupon payments.
Interest Rate/
Coupon Rate
5.00%
The coupon rate is the annual interest rate paid to the investor, calculated as a percentage of the face
value. In this example, the amount received as a coupon payment would be 5.00% x $100 face value = $5
per year.
The coupon rate can be fixed (usually paid semi-annually) or floating (usually paid quarterly). For floating
coupons, the rate is expressed as a margin (in basis points) over a reference rate. If paid quarterly, this is
usually the 90 day Bank Bill Swap (BBSW) rate.
Maturity Date
30-June-2015
The date the issuer is required to repay the par value to the investor. Bonds are generally issued with a
minimum of one year to maturity, however the date can be as long as required, and assuming investors
will lend money to the issuer for that period.
Fundamentals of Fixed Income
How Can I Value a Bond?
There are a number of metrics that indicate the markets
price expectations of a bond. Unlike equities, where shares
are traded on the stock exchange, bonds mostly trade in the
over-the-counter (OTC) market, and as such, pricing is not
as readily and transparently available. Three common bond
pricing metrics include;
Figure 2: Bond Valuation Relationship Between Price
and Interest Rates
Price
Bond Price
Often this is an average of OTC prices traded throughout
the day.
If the bond price is above face value (using the previous
example, $105 versus $100), it is said to be ‘trading at a
premium’. If it is below face value (i.e. $95), it is said to be
‘trading at a discount’. If it is at face value (i.e. $100), it is
said to be ‘trading at par’.
Current Yield
The current or ‘market’ yield refers to the annual yield the
investor should expect to receive at the current market price.
It is calculated by taking the annual coupon rate divided by
the market price.
Yield to Maturity
The yield to maturity is the annual yield the investor should
expect to receive should the investor hold the bond until
maturity. It takes into account the purchase price (i.e. whether
it was at a discount or premium), the value of all remaining
coupons and any capital gain or loss associated with the face
value being return at maturity.
What Affects the Price of a Bond?
There are several factors and key economic relationships
which can influence bond pricing.
Interest Rates
The fundamental relationship in bond valuation is that
between a bond price and interest rates. In general, as market
interest rates rise, bond prices fall, and vice versa as per Figure
1 at right top.
State Street Global Advisors
Interest Rates
Source: Fabozzi, F. (2006) Fixed Income Mathematics.
This inverse relationship ensures that the price of bonds
issued at the previously lower (or higher) interest rates remain
competitive with new bonds issued at the now higher (or lower)
prevailing interest rates.
If the coupon rate paid on the bond is higher than the market
interest rate, the bond should trade at a premium and if it is less
than the market interest rate, it should trade at a discount, all
else being equal.
Credit Quality
The identity of a bond’s issuer is a major factor in determining
its market value as it assesses the likelihood of default on behalf
of the issuer. In general, bonds issued by the Commonwealth
government are regarded as risk free as the probability of
default is very small. This is because the government can always
use taxes to raise revenue to repay debt. However, issuers such
as banks or industrial corporations cannot raise taxes and
therefore their probability of default is higher relative to
government bonds. The higher the market perceives an issuers
credit risk to be, the higher
2
Fundamentals of Fixed Income
Maturity (and the Term Structure of Interest Rates)
The maturity date of a bond also greatly impacts its market
value and is underpinned by a key economic relationship called
the Term Structure of Interest Rates, otherwise known as the
‘Yield Curve’. The yield curve gauges the markets expectations
about future interest rates by plotting the yield-to-maturities
of various bonds (Commonwealth government bonds are often
used as benchmarks) at staggered maturities.
Figure 4: Inverted Yield Curve
Yield
Figure 3: Normal Yield Curve
Yield
Maturity
Source: Fabozzi, F. (2006) Fixed Income Mathematics.
Inverted Yield Curve
In contrast, an inverse yield curve arises from extraordinary
market conditions where volatility and uncertainty govern
current investor sentiment.
Maturity
Source: Fabozzi, F. (2006) Fixed Income Mathematics.
Normal Yield Curve
This shape can suggest stable economic conditions, minimal
economic data shocks and normal forecasted growth rates.
As such, shorter dated fixed income securities are expected to
receive lower yields than longer dated securities, reflecting the
less risky economic environment and therefore a strong chance
of receiving the face value back at maturity. Conversely, the
increased uncertainty in relation to market conditions further
into the future imply that longer dated securities should carry
a higher yield to compensate for the additional risk.
In this case, shorter dated securities generally attract higher
yields than longer dated securities, as the market expects
interest rates to decline over time as the economy experiences
a slow down following the adverse market conditions.
All of these characteristics need to be analysed when
determining the relative value of of a bond and whether
to include it in a diversified bond portfolio.
Invest In Fixed Income With ETFs
Today, Australian investors can gain direct exposure to
the local fixed income market with ease and transparency
through fixed income ETFs
SPDR® S&P/ASX Australian Bond Fund
[Ticker: BOND]
SPDR S&P/ASX Australian Government Bond Fund
[Ticker: GOVT]
Learn more at spdrs.com.au
State Street Global Advisors
3
Fundamentals of Fixed Income
ssga.com
spdrs.com.au
For public use.
State Street Global Advisors Australia Services Limited Level 17, 420 George
Street, Sydney, NSW 2000. 1300 665 385.
Issued by State Street Global Advisors, Australia, Limited (ABN 42 003 914 225)
is the holder of an Australian Financial Services Licence (AFSL Number 238276).
Registered Office: Level 17, 420 George Street, Sydney, NSW 2000, Australia.
T: +612 9240 7600. F: +612 9240 7611.
Investors should read and consider the Product Disclosure Statement (PDS) for the
relevant SPDR® ETF carefully before making an investment decision. A copy of the
PDS is available atspdrs.com.au. The material is general information only and does
not take into account your individual objectives, financial situation or needs. It should
not be considered a solicitation to buy or sell a security.
ETFs trade like stocks, are subject to investment risk, fluctuate in market value and
may trade at prices above or below the ETF’s net asset value. ETFs typically invest by
sampling an index, holding a range of securities that, in the aggregate, approximates
the full Index in terms of key risk factors and other characteristics. This may cause the
fund to experience tracking errors relative to performance of the index.
Diversification does not ensure a profit or guarantee against loss. Sector ETFs
products are also subject to sector risk and non-diversification risk, which generally
results in greater price fluctuations than the overall market. Brokerage commissions
and ETF expenses will reduce returns and transaction costs will also be incurred
when buying or selling units of an ETF on ASX markets. ETF units may only be
redeemed directly by persons called “Authorised Participants”.
ETF registered with the United States Securities and Exchange Commission under
the Investment Company Act of 1940 and principally listed and traded on NYSE Arca,
Inc. under the symbol “SPY”. SSGA ASL is the AQUA Product Issuer for the CHESS
Depositary Interests (or “CDIs”) which have been created over units in SPY and are
quoted on the AQUA market of the ASX. The rights of CDI investors are different
to those of investors in an Australian registered managed investment scheme
and investors should read the applicable PDS before investing to understand the
additional risk factors associated with investing in CDIs.
An investment in SPDR funds or SPY CDIs do not represent a deposit with or liability
of any company in the State Street group of companies including State Street Bank
and Trust Company and are subject to investment risk including possible delays in
repayment and loss of income and principal invested. No company in the State Street
group of companies guarantees the performance of SPDR funds or SPY CDIs, the
repayment of capital or any particular rate of return.
SPDR and Standard & Poor’s® S&P® Indices are trademarks of Standard & Poor’s
Financial Services LLC and have been licensed for use by State Street Corporation.
The Dow Jones Global Select Real Estate Securities Index is a product of S&P Dow
Jones Indices LLC or its affiliates and has been licensed for use by SSGA. MSCI
Indices, the property of MSCI, Inc. (“MSCI”), and “ASX”, a registered trademark of
ASX Operations Pty Limited, have been licensed for use by SSGA. SPDR products
are not sponsored, endorsed, sold or promoted by any of these entities and none of
these entities bear any liability with respect to the ETFs or make any representation,
warranty or condition regarding the advisability of buying, selling or holding units in
SPDR products.
SSGA ASL is the issuer of units in the SPDR funds and the Responsible Entity for
the managed investment scheme Australian SPDR funds quoted on the ASX or
AQUA Product Issuer for those Australian SPDR funds quoted on the AQUA market
of the ASX.
Standard & Poor’s®, S&P® and SPDR® are registered trademarks of Standard &
Poor’s Financial Services LLC (S&P); Dow Jones is a registered trademark of Dow
Jones Trademark Holdings LLC (Dow Jones); and these trademarks have been
licensed for use by S&P Dow Jones Indices LLC (SPDJI) and sublicensed for certain
purposes by State Street Corporation. State Street Corporation’s financial products
are not sponsored, endorsed, sold or promoted by SPDJI, Dow Jones, S&P, their
respective affiliates and third party licensors and none of such parties make any
representation regarding the advisability of investing in such product(s) nor do
they have any liability in relation thereto, including for any errors, omissions, or
interruptions of any index.
State Street Bank and Trust Company (ABN 70 062 819 630) (AFSL number 239679)
is the trustee of, and the issuer of interests in, the SPDR® S&P 500® ETF Trust, an
The whole or any part of this work may not be reproduced, copied or transmitted or
any of its contents disclosed to third parties without SSGA’s express written consent.
Bonds generally present less short-term risk and volatility than stocks, but contain
interest rate risk (as interest rates rise, bond prices usually fall); issuer default
risk; issuer credit risk; liquidity risk; and inflation risk. These effects are usually
pronounced for longer-term securities. Any fixed income security sold or redeemed
prior to maturity may be subject to a substantial gain or loss.
State Street Global Advisors
© 2015 State Street Corporation. All Rights Reserved.
ID3674-AUSMKT-1790 0415 Exp. Date: 31/03/2016


