1. Basic Atmospheric Properties
advertisement
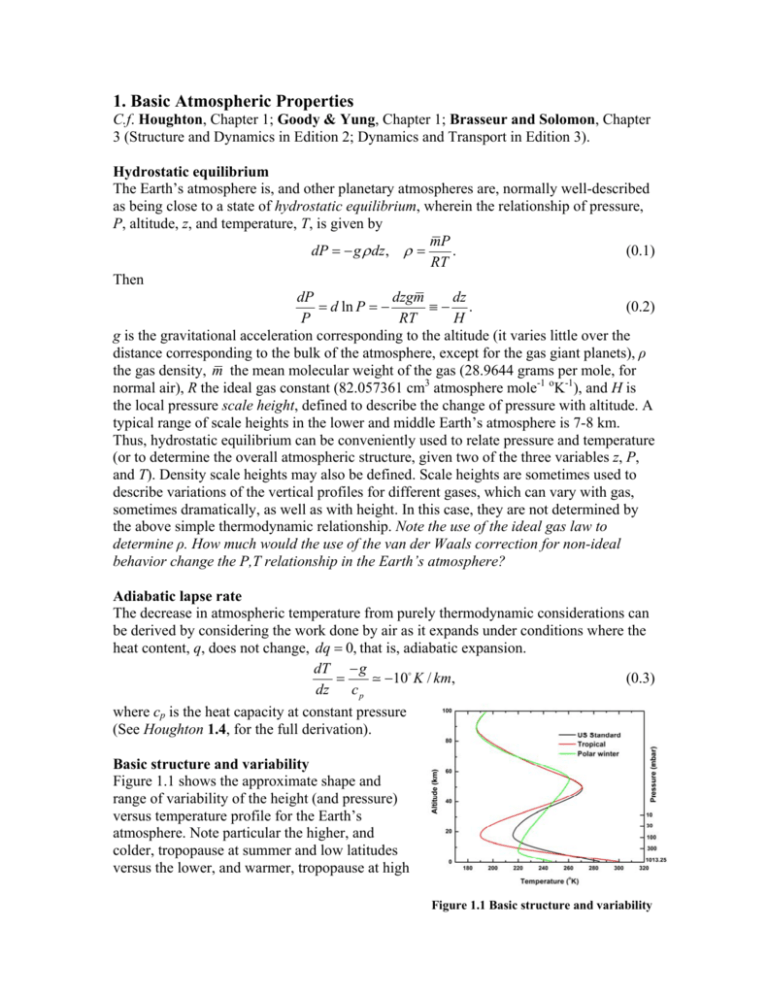
1. Basic Atmospheric Properties C.f. Houghton, Chapter 1; Goody & Yung, Chapter 1; Brasseur and Solomon, Chapter 3 (Structure and Dynamics in Edition 2; Dynamics and Transport in Edition 3). Hydrostatic equilibrium The Earth’s atmosphere is, and other planetary atmospheres are, normally well-described as being close to a state of hydrostatic equilibrium, wherein the relationship of pressure, P, altitude, z, and temperature, T, is given by mP dP g dz, . (0.1) RT Then dP dzgm dz d ln P . (0.2) P RT H g is the gravitational acceleration corresponding to the altitude (it varies little over the distance corresponding to the bulk of the atmosphere, except for the gas giant planets), ρ the gas density, m the mean molecular weight of the gas (28.9644 grams per mole, for normal air), R the ideal gas constant (82.057361 cm3 atmosphere mole-1 oK-1), and H is the local pressure scale height, defined to describe the change of pressure with altitude. A typical range of scale heights in the lower and middle Earth’s atmosphere is 7-8 km. Thus, hydrostatic equilibrium can be conveniently used to relate pressure and temperature (or to determine the overall atmospheric structure, given two of the three variables z, P, and T). Density scale heights may also be defined. Scale heights are sometimes used to describe variations of the vertical profiles for different gases, which can vary with gas, sometimes dramatically, as well as with height. In this case, they are not determined by the above simple thermodynamic relationship. Note the use of the ideal gas law to determine ρ. How much would the use of the van der Waals correction for non-ideal behavior change the P,T relationship in the Earth’s atmosphere? Adiabatic lapse rate The decrease in atmospheric temperature from purely thermodynamic considerations can be derived by considering the work done by air as it expands under conditions where the heat content, q, does not change, dq 0, that is, adiabatic expansion. dT g (0.3) 10 K / km, dz cp where cp is the heat capacity at constant pressure (See Houghton 1.4, for the full derivation). Basic structure and variability Figure 1.1 shows the approximate shape and range of variability of the height (and pressure) versus temperature profile for the Earth’s atmosphere. Note particular the higher, and colder, tropopause at summer and low latitudes versus the lower, and warmer, tropopause at high Figure 1.1 Basic structure and variability latitude spring (except in the polar vortex). See Houghton, Figure 5.1 for more detail. The lowest layer of the Earth’s atmosphere is the troposphere. The temperature decreases with altitude, due to the thermodynamic lapse until the decrease is balanced by radiative heating in the stratosphere (particularly absorption of UV radiation by ozone). This point is the tropopause, which normally located between 8-18 km, dependent on location and season. Temperature then rises in the stratosphere, due to absorption by O3 and, especially higher in the stratosphere, by O2, until the stratopause (about 50 km), the boundary between the stratosphere and mesosphere. Temperature decreases through thermodynamic lapse in the mesosphere until the mesopause (about 82 km), its boundary with the thermosphere, where temperature rises again, now due to absorption of shorterwavelength UV by O2. The course website gives examples of z, P, and T for tropical, midlatitude summer and winter, subarctic summer and winter, and the U.S. 1976 Standard Atmosphere (afgl.dat). There is a higher spatial resolution atmosphere available: us76.dat. The U.S. Standard Atmosphere monographs, particularly U.S. Standard Atmosphere, 1976, are available at the Blue Hill collection at Gordon McKay, Lamont, Physics Research, and Wolbach (Observatory). For future reference, profiles-bs-rev.dat contains typical atmospheric profiles of constituent mixing ratios, adapted from Brasseur and Solomon (In references: See for good discussions of stratospheric distributions in particular, by chemical families). Homework problem (assigned January 26, due February 7) Use the data in us76.dat to determine the atmospheric scale height from the ground to the stratopause. Plot it against altitude and also against temperature. Units for light wavelengths and frequencies, for use in spectroscopy and radiative transfer. Note that spectroscopy is somewhat stuck at cgs units (centimeter-gram-second) as opposed to the more modern and preferred MKS (meter-kilogram-second), and still sometimes uses Ångstroms for wavelengths in the visible and ultraviolet (10Å = 1 nanometer). Remembering that E h hc hc / , where h is Planck’s constant (6.626069310-27 erg s) and σ is used for wavenumbers (cm-1): Visible ← wavelength (λ) frequency (ν) → 1000 100 10 nm 1000 100 10 1 0.1 m 1 10 100 1000 104 105 cm-1 300 3000 MHz 30 300 3000 GHz 0.3 3 30 THz |← HITRAN →| → eV, MeV, TeV Table 1.3.1 Wavelength and frequency ranges nm are nanometers, μm are micrometers (or “microns”), cm-1, as before, are wavenumbers (not “inverse centimeters” or “reciprocal centimeters”), and the last three rows are megahertz, gigahertz, and terahertz. The distinction between the use of frequency versus wavelength is often due to instrument technique and/or spectral range: radiofrequency (RF), microwave, heterodyne techniques frequency; Fourier transform spectrometer (FTS) frequency (usually cm-1), since their spectra are linear with energy. Dispersive instruments (grating/prism spectrometers) wavelength, since their spectra are linear with wavelength (approximately so in the case of prisms, more exactly so for gratings). To emphasize, the relationships E h hc hc / tell how to convert among units. Thus, a frequency of 200 cm-1 corresponds to a frequency of 5.9958491012 Hz (5.995849 THz, 5.995849103 GHz, 5.995849106 MHz), and a wavelength of 0.005 cm (50 μm, 50,000 nm, 500,000 Å). Homework problem (assigned January 26, due February 7) on units – MKS versus cgs, wavelengths versus wavenumbers and frequencies. Construct a table showing wavelengths and frequencies (nm, μm, cm-1, MHz, GHz, and THz) for: CO 1→0 and 2←0 band centers (2143.272 cm-1; 4260.063 cm-1); ClO MLS emission line (204.35 GHz); O2 A band center (13120.909 cm-1); CO2 15 m “greenhouse” band (667.380 cm-1); O3 TOMS “on” wavelength (317.35 nm).
