Automated Dysarthria Severity Classification for
advertisement
Automated Dysarthria Severity Classification for Improved Objective
Intelligibility Assessment of Spastic Dysarthric Speech
Milton Sarria Paja and Tiago H. Falk
Institut National de la Recherche Scientifique (INRS-EMT)
University of Quebec, Montreal, QC, Canada
Abstract
In this paper, automatic dysarthria severity classification is explored as a tool to advance objective intelligibility prediction of spastic dysarthric speech. A Mahalanobis distance-based discriminant analysis classifier
is developed based on a set of acoustic features formerly proposed for intelligibility prediction and voice
pathology assessment. Feature selection is used to sift
salient features for both the disorder severity classification and intelligibility prediction tasks. Experimental results show that a two-level severity classifier combined
with a 9-dimensional intelligibility prediction mapping
can achieve 0.92 correlation and 12.52 root-mean-square
error with subjective intelligibility ratings. The effects
of classification errors on intelligibility accuracy are also
explored and shown to be insignificant.
Index Terms: Intelligibility, dysarthria, diagnosis.
1. Introduction
Discriminating healthy and pathological speech patterns
is essential to the clinical diagnosis of speech disorders,
which is usually carried out by e.g., speech-language
pathologists and vocologists. Moreover, characterizing
the effects of a particular speech disorder on intelligibility is also crucial, as it helps identify disorder severity, guides treatments and interventions, as well as documents improvements over time. Commonly, such analyses are performed via subjective listening tests, which
are costly, laborious, and prone to examiner internal biases (e.g., knowledge of the patient and/or their disorder). Automatic acoustical analysis for classification and
intelligibility prediction, on the other hand, has several
advantages, such as repeatability, cost and labour reduction, and it opens doors for remote patient rehabilitation.
Ongoing efforts have focused on objective disorder classification and intelligibility estimation (e.g., [1, 2])
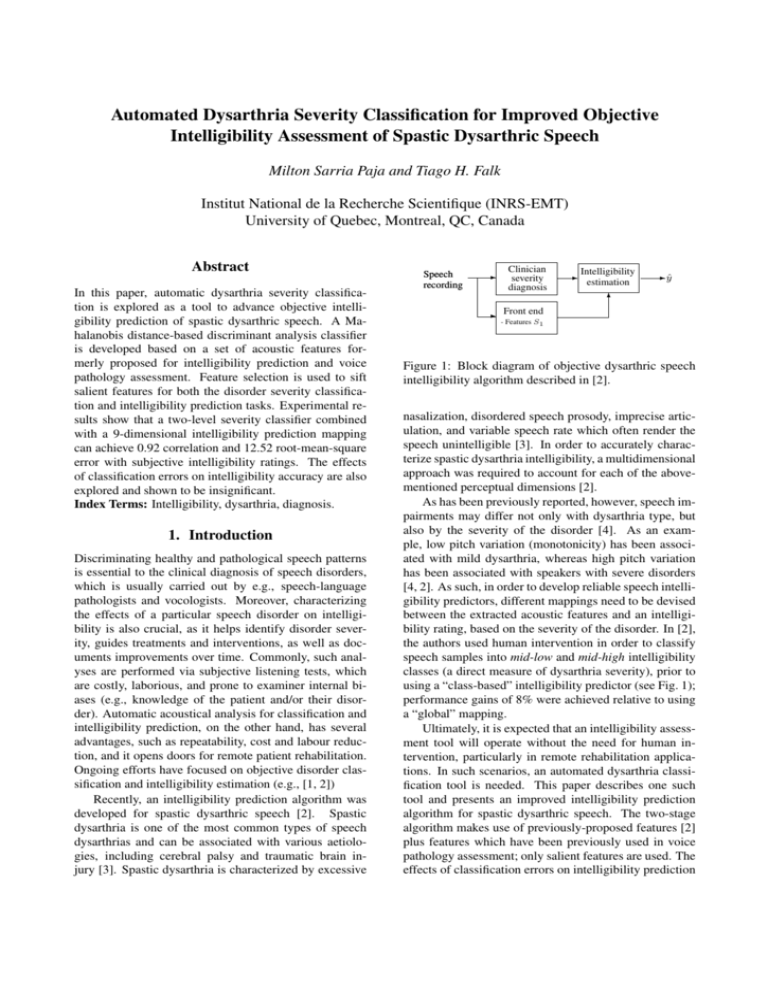
Recently, an intelligibility prediction algorithm was
developed for spastic dysarthric speech [2]. Spastic
dysarthria is one of the most common types of speech
dysarthrias and can be associated with various aetiologies, including cerebral palsy and traumatic brain injury [3]. Spastic dysarthria is characterized by excessive
Speech
recording
-
Clinician
severity
diagnosis
Front end
- Intelligibility
estimation
- ŷ
6
- Features S1
Figure 1: Block diagram of objective dysarthric speech
intelligibility algorithm described in [2].
nasalization, disordered speech prosody, imprecise articulation, and variable speech rate which often render the
speech unintelligible [3]. In order to accurately characterize spastic dysarthria intelligibility, a multidimensional
approach was required to account for each of the abovementioned perceptual dimensions [2].
As has been previously reported, however, speech impairments may differ not only with dysarthria type, but
also by the severity of the disorder [4]. As an example, low pitch variation (monotonicity) has been associated with mild dysarthria, whereas high pitch variation
has been associated with speakers with severe disorders
[4, 2]. As such, in order to develop reliable speech intelligibility predictors, different mappings need to be devised
between the extracted acoustic features and an intelligibility rating, based on the severity of the disorder. In [2],
the authors used human intervention in order to classify
speech samples into mid-low and mid-high intelligibility
classes (a direct measure of dysarthria severity), prior to
using a “class-based” intelligibility predictor (see Fig. 1);
performance gains of 8% were achieved relative to using
a “global” mapping.
Ultimately, it is expected that an intelligibility assessment tool will operate without the need for human intervention, particularly in remote rehabilitation applications. In such scenarios, an automated dysarthria classification tool is needed. This paper describes one such
tool and presents an improved intelligibility prediction
algorithm for spastic dysarthric speech. The two-stage
algorithm makes use of previously-proposed features [2]
plus features which have been previously used in voice
pathology assessment; only salient features are used. The
effects of classification errors on intelligibility prediction
accuracy is also assessed and shown to be insignificant.
2. Proposed spastic dysarthria severity
classification and intelligibility prediction
2.1. Previously-explored acoustic features
In [2], several acoustic features were extracted from
speech signals in order for perturbations across multiple
perceptual dimensions to be characterized. More specifically, features were extracted to characterize atypical vocal source excitation, temporal dynamics, nasality, and
prosody. A subset of six of these features were shown
to be useful for speech intelligibility prediction. While
a complete description of the six features is beyond the
scope of this paper (the interested reader is referred to [2]
for more details), a quick description is given here for the
sake of completeness.
First, in order to characterize atypical vocal source
excitation (related to vocal harshness, breathiness), the
kurtosis of the linear prediction (LP) residual (KLP ) signal was used. Commonly, the residual signal characterizes the vocal source excitation. The LP residual signal of
healthy clean speech is characterized by strong impulselike peaks associated with glottal pulses. For pathological
speech, more noise-like excitation patterns are observed,
which in turn cause a decrease in the LP residual kurtosis. Second, in order to characterize speech temporal
impairments (e.g., unclear distinction between adjacent
phonemes due to imprecise placement of articulators),
two features were developed, one focusing on short-term
(60 ms) temporal dynamics and the other on long-term
(256 ms) dynamics. The former was characterized by
the rate-of-change of the signal log-energy, computed as
the standard deviation of the delta zeroth order cepstral
coefficient (σ∆c0 ). The latter, in turn, made use of an
auditory-inspired modulation spectral signal representation [5] and represented the ratio of modulation spectral energy at modulation frequencies lower than 4 Hz to
modulation frequencies greater than 4 Hz; the feature is
termed low-to-high modulation energy ratio (LHMR).
Lastly, while nasality related parameters did not contribute to the task at hand, three prosody-related features
stood out, namely the standard deviation of the fundamental frequency (σf0 ), the range of f0 (∆f0 ), and percentage of voiced segments in the uttered word (%V). For
notation purposes, these six features are grouped into a
feature set termed S1 and given by:
S1 = {KLP , σ∆c0 , LHMR, σf0 , ∆f0 , %V}.
2.2. Alternate complementary features
While the feature set S1 described above proved useful
for automated intelligibility prediction, the six proposed
features may not be optimal for automated disorder severity classification. To this end, we explore the inclusion
of alternate features which have been explored for voice
pathologies. More specifically, we target three new representations, namely mel frequency cepstral coefficients
(MFCCs), glottal-to-noise excitation ratio (GNE), and
harmonics-to-noise ratio (HNR). MFCCs were considered here due to their capability of capturing irregular
vocal fold movements or the lack of vocal-fold closure
due to mass/tissue changes [6]; 11th order MFCCs were
used in the experiments described herein.
The GNE and HNR features, in turn, were introduced
for their capability of measuring the degree of “noise”
generated by the disorders. GNE quantifies the ratio of
excitation due to vocal fold oscillations versus the excitation given by turbulent noise [7]. The feature is closely
related to breathiness but somewhat complementary to
the KLP feature described above. Lastly, HNR measures
the ratio between the energy of periodic signal components to the energy of aperiodic signal components. It
can be seen as a signal-to-aspiration noise ratio when
other aperiodicities in the signal are comparatively low
[8]. The three abovementioned feature representations
are computed on a per-window basis (40ms Hamming
windows, 50% overlap). For the task at hand, four statistical values are computed over the duration of the speech
signal: mean, standard deviation, skewness, and kurtosis.
In the case of the MFCC feature representation, the four
statistical values are computed for each of the 11 coefficients. For notation purposes, the 52 new acoustic feature
set (4 × 11 MFCCs + 4×GNE + 4×HNR) is termed S2 .
2.3. Proposed system
Figure 2 depicts the block diagram of the proposed
dysarthric speech intelligibility prediction system. It
builds on the previously-developed algorithm (see Fig. 1)
by replacing the clinician-dependent severity classification block by one that is automated.∪ A larger pool
of acoustic features are extracted (S1 S2 ) and salient
features are found for both the classification and prediction tasks at hand. For salient feature selection, a
correlation-based sequential feature selection algorithm
is used. For intelligibility estimation, a composite linear
mapping function g(·) is used to estimate intelligibility
ratings (ŷ) from N features fi , i.e.:
ŷ = g(f) = A0 +
N
∑
Ai fi .
(1)
i=1
With the proposed system, two mapping functions are
used, namely gmid−low and gmid−high , to predict intelligibility scores of moderate-to-severe (mid-to-low intelligibility levels) and moderate-to-mild (mid-to-high intelligibility levels) dysarthric speakers, respectively. Having
said this, the developed classifiers have been trained to
discriminate between these two severity classes.
Speech
recording
-
Front end
- Features S1
- Features S2
-
Automated
severity
classification
-
Subset of
∪
S1 S2
-
Intelligibility
estimation
- ŷ
6
Figure 2: Block diagram of the proposed combined severity classiifcation and intelligibility estimation system.
3. Experimental Setup
The data used in our experiments consisted of the audio content of the Universal Access (UA-Speech) audiovisual database made publicly-available by the University of Illinois and described in detail in [9]. The dataset
was originally recorded using a 7-channel microphone array; here, data recorded from the centre microphone was
used, as in [2]. Data from 10 spastic dysarthric speakers
(3 female) were used and covered a wide range of disorder severity, ranging from 2% to 95% word intelligibility.
Each speaker read 765 isolated word utterances including
the 10 digits (zero to nine), 26 radio alphabet letters (e.g.,
Alpha, Bravo), 19 computer commands (e.g., backspace,
delete), the 100 most common words in the Brown corpus
of written English (e.g., it, is, you), and 300 uncommon
words selected from children’s novels [9].
To evaluate the discriminative capabilities of the different features, three different discriminant analysis classifiers were explored based on linear, quadratic and
Mahalanobis-distance discriminant functions. Randomized bootstrap (15-fold) cross validation was used with
70% of the input data recordings kept for system training
and 30% left for validation. Classification accuracy is reported as average accuracy ± the standard error across
the 15 cross-validation trials [10]. Moreover, in order to
explore the effects of dysarthria severity misclassification
on intelligibility prediction accuracy, two scenarios were
investigated. The first, considered the gold standard for
the task at hand, assumes perfect classification, akin to
what would be achieved with an experienced clinician
(scenario #1). The second represents a more practical
system which uses the trained classifier to select from the
possible gmid−low or gmid−high mapping functions (scenario #2). Two system performance metrics were used,
namely the root-mean-square error and the Pearson correlation coefficient computed between the true subjective
intelligibility ratings and the estimated scores.
4. Experimental results
4.1. Dysarthria severity classification
Table 1 reports the classification accuracy obtained with
different feature set combinations and classifiers. More
Table 1: Classification accuracy using different feature
combinations and classifiers.
feature
set
S1
S2
FS {S2 }
FS{S2 }+S1
Linear
83.9 ± 0.04
87.9 ± 0.04
86.2 ± 0.03
91.8 ± 0.03
Classifier
Quadratic
82.5 ± 0.03
93.0 ± 0.03
92.5 ± 0.04
94.3 ± 0.02
Mahalanobis
83.5 ± 0.05
92.4 ± 0.03
92.5 ± 0.03
94.9 ± 0.03
specifically, the following feature set combinations were
explored: S1 alone, S2 alone, the 28 most salient S2 features (represented as ‘FS{S2 }’), and a combination of S1
and FS{S2 }. As can be seen, for S1 , all three classifiers resulted in similar accuracy. For all other feature
combinations, quadratic and Mahalanobis-distance based
classifiers resulted in improved performance. Overall, the
Mahalanobis distance classifier with the FS{S2 }+S1 feature set resulted in the best accuracy (95%).
4.2. Dysarthric speech intelligibility prediction
In order to develop the composite mappings gmid−low
and gmid−high , the UA-Speech database was partitioned into two disjoint sets. Speech files belonging to
the“uncommon word” category (300 files per participant)
served as unseen test data and the remaining files (465
files per participant) served as training data and were used
to i) select salient features for intelligibility prediction
and ii) to obtain the weights Ai for the mapping functions (1). As with the classifier, sequential forward feature selection was used to sift the top features for intelligibility prediction. Table 2 shows the top-9 features
selected for prediction along with their correlations (R)
with the subjective intelligibility rating. As can be seen,
five of the nine features are those previously proposed in
[2] and four are complementary ones explored here. The
new feature
∪ set with these nine features is represented as
‘FS{S1 S2 }’. Table 3 shows the weights Ai from (Eq.
1) obtained for the gmid−low and gmid−high mappings.
The difference in weight values between the two mappings corroborates previous findings showing that speech
impairments also differ by severity level [2, 4].
Lastly, in order to investigate the potential detrimental
effects of severity level misclassification on intelligibility
prediction, Table 4 shows the correlation (R) and rootmean-square error (εrms ) between subjective and predicted intelligibility ratings in scenarios #1 and #2, as described in Section 3. For scenario #2, the Mahalanobisbased classifier trained on the FS{S2 } + S1 feature set
was used. As can be seen, by using the feature set S1
proposed in [2], the 5% classification error seen in Table 1 resulted in a 3% decrease in R and a 7% increase
in εrms relative to the gold standard. With the updated
Table 2: Nine most salient features for the intelligibility
prediction task. Column ‘R’ represent the correlation between the feature and the subjective intelligibility rating
feature
σc2
KLP
%V
σ∆c0
c̄4
∆f0
LHMR
σc1
σc11
Table 4: Performance comparison under two experimental scenarios (see Section 3 for more details)
feature
set
S1∪
FS{S1 S2 }
R
0.90
0.89
-0.83
0.79
0.75
-0.72
0.69
0.67
-0.66
scenario 1
R
εrms
0.95 13.43
0.96 11.96
scenario 2
R
εrms
0.92 14.41
0.92 12.52
and another for mid-to-high levels. When combined, improvements of up to 13% in intelligibility prediction accuracy could be achieved. Lastly, the effects of severity
classification errors on intelligibility prediction accuracy
was explored and found to be insignificant.
6. Acknowledgements
Table 3: Weights Ai of the two per-severity intelligibility
prediction mappings given by (Eq. 1)
Weight
A0
A1 (σc2 )
A2 (KLP )
A3 (%V)
A4 (σ∆c0 )
A5 (c̄4 )
A6 (∆f0 )
A7 (LHMR)
A8 (σc1 )
A9 (σc11 )
gmid−low
18.94
2.64
1.41
-0.38
1.82
-0.31
-0.02
0.02
3.77
-1.17
gmid−high
67.53
1.83
3.60
-11.56
2.42
-2.92
-2.21
-1.63
0.94
-5.16
feature set proposed here (see Table 2), the 5% classification error resulted in a 4% decrease in R and a 4% increase in εrms . These insignificant drops in performance
are outweighed by the benefits of having an automated
system that does not require human intervention. Moreover, Table
∪ 4 shows that the updated proposed feature set
FS{S1 S2 } reduces εrms by 11% and 13% relative to
feature set S1 in scenarios #1 and #2, respectively.
5. Conclusions
The design of a two-stage scheme for spastic dysarthria
severity classification and intelligibility prediction is presented. First, different feature combinations and classifier types were explored for two-level dysarthria severity
classification (i.e., mid-to-low and mid-to-high intelligibility levels). Experimental results showed that a Mahalanobis distance-based discriminant analysis classifier
trained on a pool of 34 acoustic features could achieve
95% classification accuracy. Second, a subset of nine
salient features were used to train two intelligibility prediction mappings, one for mid-to-low intelligibility levels
The authors wish to acknowledge Dr. Mark HasegawaJohnson for making the UA-Speech database available,
and the Natural Sciences and Engineering Research
Council of Canada for their financial support.
7. References
[1] M. Sarria-Paja and G. Castellanos-Domı́nguez, “Robust pathological voice detection based on component information from hmm,”
Advances in Nonlinear Speech Processing, pp. 254–261, 2011.
[2] T. H. Falk, W.-Y. Chan, and F. Shein, “Characterization of atypical vocal source excitation, temporal dynamics and prosody for
objective measurement of dysarthric word intelligibility,” Speech
Communication, vol. 54, no. 5, pp. 622 – 631, 2012.
[3] P. Doyle, H. Leeper, A. Kotler, N. Thomas-Stonell, C. O’Neill,
M. Dylke, and K. Rolls, “Dysarthric speech: a comparison of
computerized speech recognition and listener intelligibility.,” J
Rehabil Res Dev, vol. 34, no. 3, pp. 309–16, 1997.
[4] K. Schlenck, R. Bettrich, and K. Willmes, “Aspects of disturbed
prosody in dysarthria,” Clinical linguistics & phonetics, vol. 7,
no. 2, pp. 119–128, 1993.
[5] T. Falk and W.-Y. Chan, “Temporal dynamics for blind measurement of room acoustical parameters,” Instrumentation and Measurement, IEEE Transactions on, vol. 59, pp. 978 –989, april
2010.
[6] J. I. Godino-Llorente, P. Gómez-Vilda, and M. Blanco-Velasco,
“Dimensionality reduction of a pathological voice quality assessment system based on gaussian mixture models and short-term
cepstral parameters.,” IEEE Transactions on Biomedical Engineering, vol. 53, no. 10, pp. 1943–1953, 2006.
[7] J. I. Godino-Llorente, V. Osma-Ruiz, N. Saenz-Lechon,
P. Gomez-Vilda, M. Blanco-Velasco, and F. Cruz-Roldan, “The
effectiveness of the glottal to noise excitation ratio for the screening of voice disorders,” Journal of voice : official journal of the
Voice Foundation, vol. 24, pp. 47–56, 2010.
[8] P. J. Murphy and O. O. Akande, “Noise estimation in voice signals using short-term cepstral analysis,” Journal of the Acoustical
Society of America, vol. 121, no. 3, pp. 1679–1690, 2007.
[9] H. Kim, M. Hasegawa-Johnson, A. Perlman, J. Gunderson, T. S.
Huang, K. Watkin, and S. Frame, “Dysarthric speech database for
universal access research.,” in INTERSPEECH, pp. 1741–1744,
ISCA, 2008.
[10] D. G. Altman and J. M. Bland, “Standard deviations and standard
errors.,” BMJ British Medical Journal, vol. 331, no. 7521, p. 903,
2005.


