Brine Shrimp Lab Report
Brine Shrimp Lab Report
________________
Name ______________________________________ Date ___/___/___ Period ______ 40
Problem : What variations in Great Salt Lake water help brine shrimp “eggs” hatch and survive?
Possible Variations: 1. ___________________________ 2. ___________________________
(1 point each)
3. ___________________________ 4. ___________________________
Hypothesis : (2 points)
Materials : Petri Dish Water
Red Grease pencil Beaker
Pipette Varying Salt Water concentrations
Procedure
1.
Remove petri dish top from bottom.
2.
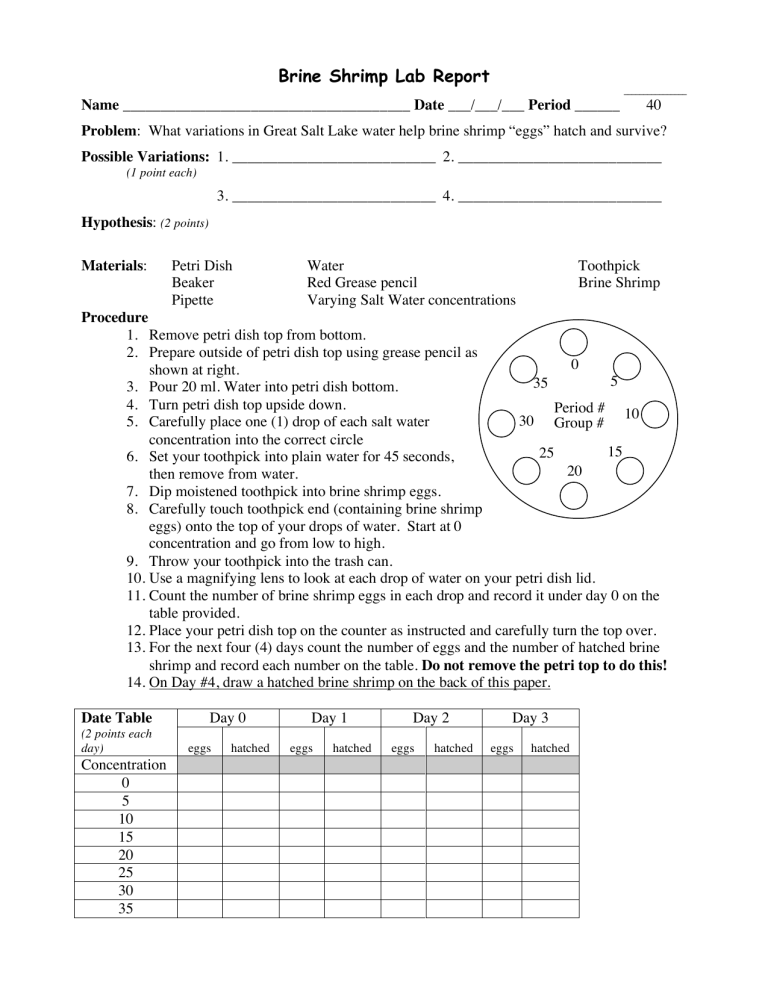
Prepare outside of petri dish top using grease pencil as
Toothpick
Brine Shrimp shown at right.
3.
Pour 20 ml. Water into petri dish bottom.
4.
Turn petri dish top upside down.
5.
Carefully place one (1) drop of each salt water concentration into the correct circle
6.
Set your toothpick into plain water for 45 seconds,
30
35
25
0
Period #
Group #
5
15
10 then remove from water.
7.
Dip moistened toothpick into brine shrimp eggs.
8.
Carefully touch toothpick end (containing brine shrimp
20 eggs) onto the top of your drops of water. Start at 0 concentration and go from low to high.
9.
Throw your toothpick into the trash can.
10.
Use a magnifying lens to look at each drop of water on your petri dish lid.
11.
Count the number of brine shrimp eggs in each drop and record it under day 0 on the table provided.
12.
Place your petri dish top on the counter as instructed and carefully turn the top over.
13.
For the next four (4) days count the number of eggs and the number of hatched brine shrimp and record each number on the table. Do not remove the petri top to do this!
14.
On Day #4, draw a hatched brine shrimp on the back of this paper.
Date Table Day 0 Day 1 Day 2 Day 3
(2 points each day)
Concentration eggs hatched eggs hatched eggs hatched eggs hatched
0
5
10
15
20
25
30
35
Percent (%) Hatched (# hatched divided by total # eggs on Day 0)
(1 points each day)
Day 0 Day 1 Day 2
Concentration
0 0
5
10
15
20
25
30
35
0
0
0
0
0
0
0
Day 3
Bargraph - Percent Hatched (Use largest percentage for each concentration -2 points each concentration)
95
90
85
80
75
70
65
60
55
50
45
40
35
30
25
20
15
10
5
0
0 5 10
Drawing of one hatched brine shrimp
(2 points)
Conclusion (2 points)
15 20
Concentration
25 30 35
