Answers to In-Class Activity #5
advertisement
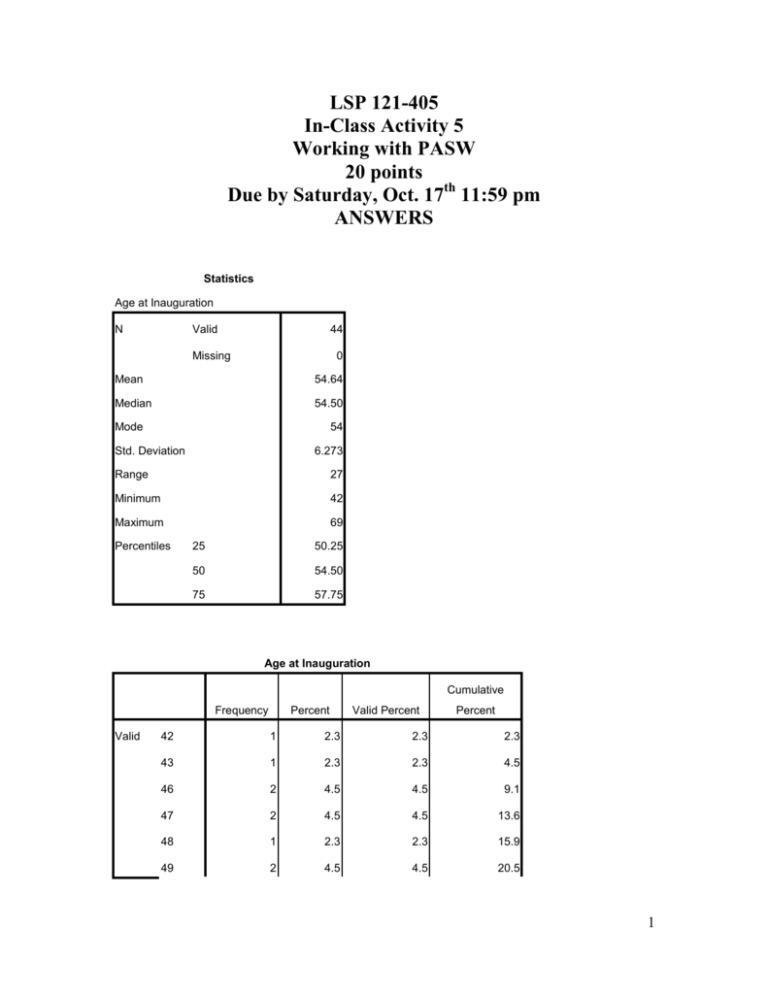
LSP 121-405 In-Class Activity 5 Working with PASW 20 points Due by Saturday, Oct. 17th 11:59 pm ANSWERS Statistics Age at Inauguration N Valid 44 Missing 0 Mean 54.64 Median 54.50 Mode 54 Std. Deviation 6.273 Range 27 Minimum 42 Maximum 69 Percentiles 25 50.25 50 54.50 75 57.75 Age at Inauguration Cumulative Frequency Valid Percent Valid Percent Percent 42 1 2.3 2.3 2.3 43 1 2.3 2.3 4.5 46 2 4.5 4.5 9.1 47 2 4.5 4.5 13.6 48 1 2.3 2.3 15.9 49 2 4.5 4.5 20.5 1 50 2 4.5 4.5 25.0 51 4 9.1 9.1 34.1 52 2 4.5 4.5 38.6 54 5 11.4 11.4 50.0 55 4 9.1 9.1 59.1 56 3 6.8 6.8 65.9 57 4 9.1 9.1 75.0 58 1 2.3 2.3 77.3 60 1 2.3 2.3 79.5 61 3 6.8 6.8 86.4 62 1 2.3 2.3 88.6 64 2 4.5 4.5 93.2 65 1 2.3 2.3 95.5 68 1 2.3 2.3 97.7 69 1 2.3 2.3 100.0 44 100.0 100.0 Total 2 1) What is the 5 number summary of this data (min, lower quartile, median, upper quartile, max)? The “5 number summary” of a data set includes the minimum, lower quartile, median, upper quartile and maximum values of the set. Minimum = 42 Lower Quartile = 50.25 Median = 54.50 Upper Quartile = 57.75 Maximum = 69 2) Who was the oldest president at inauguration? Who was the youngest? The oldest president was Ronald Reagan at 69 The youngest president was Theodore Roosevelt at 42 3) What was the mean age at inauguration? The mean age at inauguration was 54.64 3 4) How does Barack Obama compare to the mean? Was his age at inauguration within one standard deviation of the mean? Barack Obama was 47 years old at inauguration. This is below the mean value of 54.64. Since the standard deviation is 6.273, an age must be within the range from (54.64 – 6.273) = 48.37 through (54.64 + 6.273) = 60.91 to be within one standard deviation of the mean. Obama’s age of 47 is outside of this range, so it is not within one standard deviation of the mean. 5) How many presidents have been more than 2 standard deviations from this mean? Who were they? An age must be within the range from (54.64 – 2*6.273) = 42.09 through (54.64 + 2*6.273) = 67.19 to be within two standard deviations of the mean. Obama’s age of 47 is outside of this range. There are three presidents outside of this range: Theodore Roosevelt (42), William Henry Harrison (68) and Ronald Reagan (69). 6) Looking at your frequencies table, estimate the 90th percentile of this data to the nearest year. How did you determine this value? Since 90% of the values must be less than the 90th percentile value, I take the number of data values – which is 44 – and multiple by 90% = 39.6. So, this means that 39 values must be less than the 90th percentile value. So, I will take the value in the 40th position of the sorted set (since there are 39 values less than the value in the 40th position of the sorted data). The value in the 40th position of the sorted data set is 64. So the 90th percentile of the ages at inauguration is 64 years old. 7) Looking at the Histogram you got. Is it a basic Histogram (one bar for each value) or is a Bin Histogram (multiple values per bar)? If it is binned, then how many ages are there per bin (that is, per bar)? There are 5 bars in this Histogram for every 10 years of data (5 bars between 50 and 60 and 5 bars between 60 and 70), so each bar must represent 2 years of age data. Thus, the histogram is binned with 2 years of data per bin. 8) Are presidents inaugurated since Theodore Roosevelt, on average, older or younger than presidents inaugurated before Roosevelt? Create two modified data sets and calculate these two means. Copy and paste the results into your Word file. 4 Using copy-and-paste, I created two new data sets in PASW – the first one containing data for presidents before Theodore Roosevelt and the second one containing all data for presidents after Theodore Roosevelt. For each of these data sets I ran Descriptive Statistics in PASW. The resulting data sets and PASW statistics results are shown below. From these results we can see that presidents before Theodore Roosevelt had a mean age at inauguration of 55.0, while presidents after Theodore Roosevelt had a mean age at inauguration of 54.83. New Data Set #1 – Presidents before Theodore Roosevelt Descriptive Statistics N Minimum Age at Inauguration 25 Valid N (listwise) 25 1 2 3 4 5 6 7 8 9 10 11 12 13 14 15 16 17 18 19 20 57.00 61.00 57.00 57.00 58.00 57.00 61.00 54.00 68.00 51.00 49.00 64.00 50.00 48.00 65.00 52.00 56.00 46.00 54.00 49.00 George Washington John Adams Thomas Jefferson James Madison James Monroe John Quincy Adams Andrew Jackson Martin Van Buren William Henry Harrison John Tyler James K. Polk Zachary Taylor Millard Fillmore Franklin Pierce James Buchanan Abraham Lincoln Andrew Johnson Ulysses S. Grant Rutherford B. Hayes James A. Garfield 46.00 Maximum 68.00 Mean 55.0000 Std. Deviation 5.74456 5 21 22 23 24 25 Chester A. Arthur Grover Cleveland Benjamin Harrison Grover Cleveland William McKinley 50.00 47.00 55.00 55.00 54.00 New Data Set #2 Descriptive Statistics N Minimum Age at Inauguration 18 Valid N (listwise) 18 27 28 29 30 31 32 33 34 35 36 37 38 39 40 41 42 43 44 William Howard Taft Woodrow Wilson Warren G. Harding Calvin Coolidge Herbert Hoover Franklin Roosevelt Harry S. Truman Dwight D. Eisenhower John F. Kennedy Lyndon B. Johnson Richard M. Nixon Gerald Ford Jimmy Carter Ronald Reagan George H. W. Bush Bill Clinton George W. Bush Barack Obama 43.00 Maximum 69.00 Mean 54.8333 Std. Deviation 6.58206 51.00 56.00 55.00 51.00 54.00 51.00 60.00 62.00 43.00 55.00 56.00 61.00 52.00 69.00 64.00 46.00 54.00 47.00 Part II Crosstab SMOKE * SEX01 Crosstabulation 6 Count SEX01 Male SMOKE Female Total Yes 331 449 780 No 911 1330 2241 1242 1779 3021 Total 1) From this data, answer the questions: What percentage of men smoke? What percentage of women smoke? 331 men smoke out of a total of 1242 men, so the percentage of men who smoke is 331/1242 = 0.2665 = 26.65%. 449 women smoke out of a total of 1779 women, so the percentage of women who smoke is 449/1779 = 0.2524 = 25.24%. SMOKE * INC4GP Crosstabulation Count INC4GP <$20K SMOKE Total $20-40K $40-70K over $70K Refused Do not know Total Yes 125 258 199 127 49 19 777 No 245 625 633 512 165 56 2236 370 883 832 639 214 75 3013 2) 7
