Line Spectra oBJEctiVE BASic PrinciPlES Ue5020150 Ue5020150
advertisement

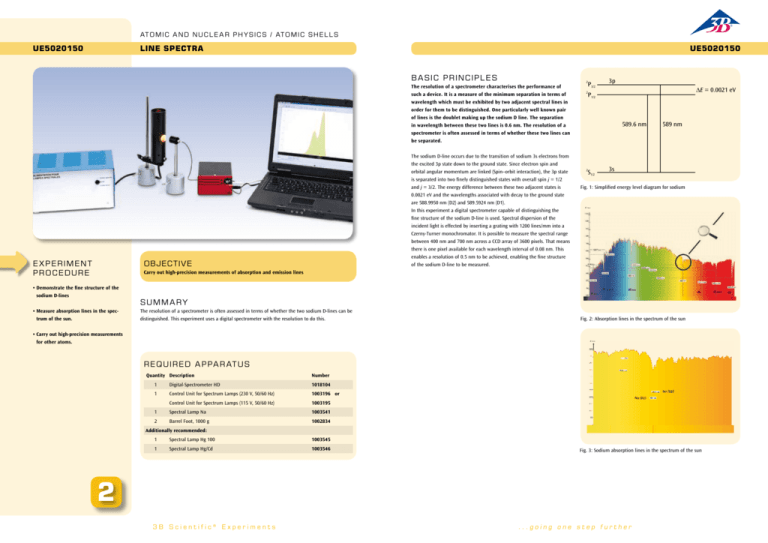
At o m i c a n d N u c l ea r P h y s i c s / At o m i c S h e l l s UE5020150 Line Spectra UE5020150 basic P RINCIP L E S The resolution of a spectrometer characterises the performance of such a device. It is a measure of the minimum separation in terms of wavelength which must be exhibited by two adjacent spectral lines in order for them to be distinguished. One particularly well known pair of lines is the doublet making up the sodium D line. The separation in wavelength between these two lines is 0.6 nm. The resolution of a spectrometer is often assessed in terms of whether these two lines can be separated. The sodium D-line occurs due to the transition of sodium 3s electrons from the excited 3p state down to the ground state. Since electron spin and orbital angular momentum are linked (Spin–orbit interaction), the 3p state is separated into two finely distinguished states with overall spin j = 1/2 and j = 3/2. The energy difference between these two adjacent states is 0.0021 eV and the wavelengths associated with decay to the ground state are 588.9950 nm (D2) and 589.5924 nm (D1). In this experiment a digital spectrometer capable of distinguishing the fine structure of the sodium D-line is used. Spectral dispersion of the incident light is effected by inserting a grating with 1200 lines/mm into a Czerny-Turner monochromator. It is possible to measure the spectral range between 400 nm and 700 nm across a CCD array of 3600 pixels. That means there is one pixel available for each wavelength interval of 0.08 nm. This enables a resolution of 0.5 nm to be achieved, enabling the fine structure of the sodium D-line to be measured. OBJECTIVE E X P ERIME NT P ROCE DURE 2 P3/2 2 P1/2 3p E = 0.0021 eV 589.6 nm 2 S1/2 589 nm 3s Fig. 1: Simplified energy level diagram for sodium E / s.u Carry out high-precision measurements of absorption and emission lines • Demonstrate the fine structure of the sodium D-lines • Measure absorption lines in the spectrum of the sun. S UMM A RY The resolution of a spectrometer is often assessed in terms of whether the two sodium D-lines can be distinguished. This experiment uses a digital spectrometer with the resolution to do this. • Carry out high-precision measurements for other atoms. Fig. 2: Absorption lines in the spectrum of the sun E / s.u Req uired A ppa r at u s Quantity Description Number 1 Digital-Spectrometer HD 1018104 1 Control Unit for Spectrum Lamps (230 V, 50/60 Hz) 1003196 or Control Unit for Spectrum Lamps (115 V, 50/60 Hz) 1003195 1 Spectral Lamp Na 1003541 2 Barrel Foot, 1000 g 1002834 Additionally recommended: 1 Spectral Lamp Hg 100 1003545 1 Spectral Lamp Hg/Cd 1003546 Fig. 3: Sodium absorption lines in the spectrum of the sun 2 3B Scientific® Experiments ...going one step further


