Ph.D. Completion and Attrition: Analysis of Baseline Demographic
advertisement
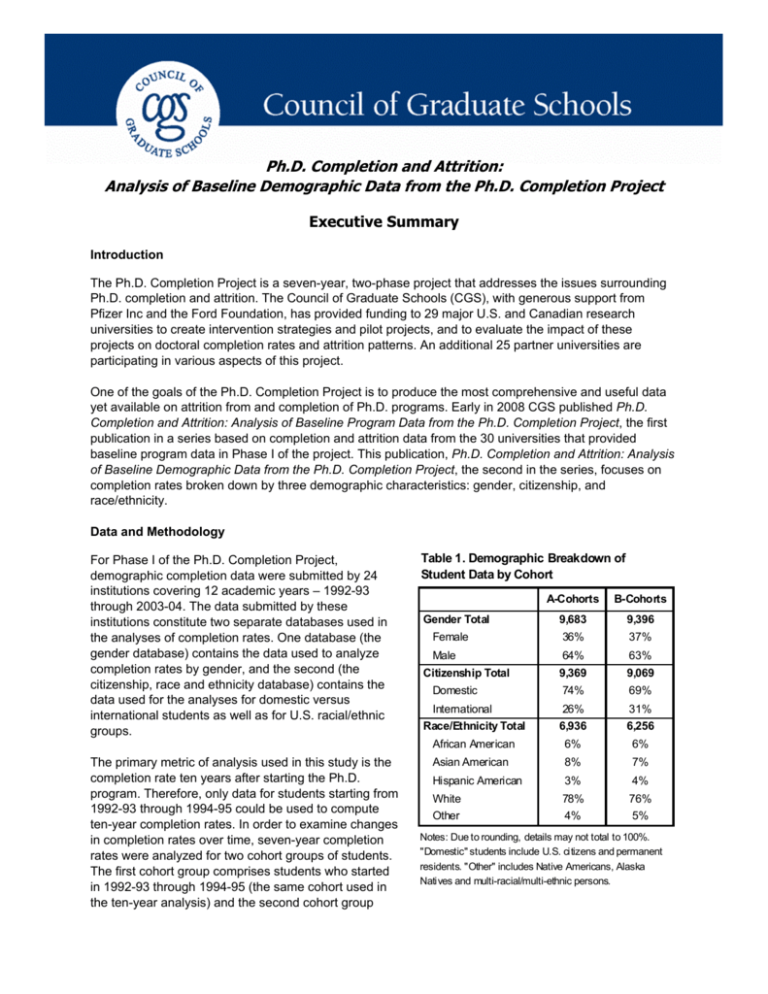
Ph.D. Completion and Attrition: Analysis of Baseline Demographic Data from the Ph.D. Completion Project Executive Summary Introduction The Ph.D. Completion Project is a seven-year, two-phase project that addresses the issues surrounding Ph.D. completion and attrition. The Council of Graduate Schools (CGS), with generous support from Pfizer Inc and the Ford Foundation, has provided funding to 29 major U.S. and Canadian research universities to create intervention strategies and pilot projects, and to evaluate the impact of these projects on doctoral completion rates and attrition patterns. An additional 25 partner universities are participating in various aspects of this project. One of the goals of the Ph.D. Completion Project is to produce the most comprehensive and useful data yet available on attrition from and completion of Ph.D. programs. Early in 2008 CGS published Ph.D. Completion and Attrition: Analysis of Baseline Program Data from the Ph.D. Completion Project, the first publication in a series based on completion and attrition data from the 30 universities that provided baseline program data in Phase I of the project. This publication, Ph.D. Completion and Attrition: Analysis of Baseline Demographic Data from the Ph.D. Completion Project, the second in the series, focuses on completion rates broken down by three demographic characteristics: gender, citizenship, and race/ethnicity. Data and Methodology For Phase I of the Ph.D. Completion Project, demographic completion data were submitted by 24 institutions covering 12 academic years – 1992-93 through 2003-04. The data submitted by these institutions constitute two separate databases used in the analyses of completion rates. One database (the gender database) contains the data used to analyze completion rates by gender, and the second (the citizenship, race and ethnicity database) contains the data used for the analyses for domestic versus international students as well as for U.S. racial/ethnic groups. The primary metric of analysis used in this study is the completion rate ten years after starting the Ph.D. program. Therefore, only data for students starting from 1992-93 through 1994-95 could be used to compute ten-year completion rates. In order to examine changes in completion rates over time, seven-year completion rates were analyzed for two cohort groups of students. The first cohort group comprises students who started in 1992-93 through 1994-95 (the same cohort used in the ten-year analysis) and the second cohort group Table 1. Demographic Breakdown of Student Data by Cohort Gender Total Female Male Citizenship Total Domestic International Race/Ethnicity Total A-Cohorts B-Cohorts 9,683 9,396 36% 37% 64% 63% 9,369 9,069 74% 69% 26% 31% 6,936 6,256 African American 6% 6% Asian American 8% 7% Hispanic American 3% 4% White Other 78% 4% 76% 5% Notes: Due to rounding, details may not total to 100%. "Domestic" students include U.S. citizens and permanent residents. "Other" includes Native Americans, Alaska Natives and multi-racial/multi-ethnic persons. comprises students who started in 1995-96 through 1997-98. We refer to these two groups as the ACohorts and B-Cohorts, respectively. Table 1 shows the demographic breakdown of the students in these two cohort groups. Using descriptive statistics, the analysis compares completion rates from various perspectives: at the aggregate level, by field, by institution type, and by time of entry into the Ph.D. program (A- versus BCohorts). Completion rates are presented for each of the three major demographic characteristics (gender, citizenship, and race/ethnicity). Completion Rates Gender Consistent with data presented in the first Ph.D. Completion Project baseline data publication, Analysis of Baseline Program Data from the Ph.D. Completion Project (CGS, 2008), the overall cumulative ten-year completion rate for the A-Cohorts is 57%. The completion rate for men (58%) is three percentage points higher than for women (55%). There is a great deal of variation in completion rates for men and women across the five broad fields studied, as Figure 1 illustrates. Men complete at higher rates than women in Engineering (by nine percentage points), Life Sciences (by eight points), and Mathematics & Physical Sciences (by seven points), while women complete at higher rates in Humanities and Social Sciences, by five and four percentage points, respectively. Completion rates for men vary greatly between broad fields, by 18 percentage points, from 47% in Humanities to 65% in Engineering. In contrast, there is only a five point difference between broad fields for women. Figure 1. Cumulative Ten-Year Ph.D. Completion Rates by Gender and Broad Field 70 65 Completion Rate (%) 65 Female 64 Male 59 60 56 58 57 56 55 55 53 52 52 50 47 45 40 Engineering Life Sciences Math & Phys. Sci. Social Sciences Humanities All The analysis of baseline program completion data (CGS, 2008) revealed that 20% of the students who complete Ph.D. degrees in ten years do so after year seven. The analysis of gender data shows an important difference in late completion (after year seven) as a function of gender. Twenty-five percent of the women who complete in ten years do so after year seven, compared with 18% of men. 2 In order to determine if completion rates changed over time, cumulative seven-year completion rates were computed for female and male students in the A- and B-Cohorts. The overall differences are very small with the B-Cohorts completing at slightly higher rates, up to two percentage points for both female and male students. Men in both the A- and B-Cohorts complete at rates six to seven percentage points higher than women. Citizenship Analyses of the demographic data indicate that international students complete at a significantly higher rate than domestic students. The cumulative ten-year completion rate for international students is 67%, 13 percentage points higher than domestic students (see Figure 2). International students also complete at higher rates than domestic students in all five broad fields in the study. The differences range from 17 percentage points in Mathematics & Physical Sciences to two percentage points in Humanities. Figure 2. Cumulative Ten-Year Ph.D. Completion Rates by Citizenship and Broad Field Domestic International 75 70 Completion Rate (%) 70 68 66 67 63 65 60 58 58 55 56 51 50 52 54 50 45 40 Engineering Life Sciences Math & Phys. Sci. Social Sciences Humanities All The proportion of ten-year completers who earn their degrees after year seven is higher for domestic students (24%) than for international students (12%). Cumulative seven-year completion rates improve over time for domestic students, but not for international students. Domestic completion rates increase three percentage points between the A- and B-Cohorts, while international completion rates decrease by four percentage points. Race and Ethnicity Among the four racial/ethnic groups of domestic students in this study, White students have the highest cumulative ten-year completion rate at 55%, compared to 51% for Hispanic Americans, 50% for Asian Americans, and 47% for African Americans. The cumulative ten-year completion rates for the racial/ethnic groups vary widely across broad fields (see Figure 3). African Americans and Whites complete at the highest rate (60%) in the Life Sciences. White students also complete at the highest rate in Engineering (60%), five percentage points ahead of Hispanic Americans and seven points ahead of Asian Americans. Asian Americans (53%), Hispanic Americans 3 (53%), and Whites (52%) complete at similar rates in Mathematics & Physical Sciences. African American students have the highest rate (52%) in the Humanities, followed closely by White students (51%). White students complete at the highest rate (57%) in Social Sciences, two percentage points ahead of Hispanic Americans. Figure 3. Cumulative Ten-Year Ph.D. Completion Rates by Race/Ethnicity and Broad Field African American Asian American Hispanic American White 65 60 60 60 Completion Rate (%) 60 53 55 50 55 47 54 55 53 53 52 47 57 52 47 44 45 40 37 51 46 37 35 30 Engineering Life Sciences Math & Phys. Social Sciences Sci. Humanities Among domestic students who complete their degrees within ten years, Hispanic Americans have the highest late completion rate. Thirty-six percent of Hispanic Americans who complete in ten years do so after year seven, compared with 27% of African Americans and 23% of Asian Americans and Whites. Cumulative seven-year completion rates for the B-Cohorts are higher than for the A-Cohorts for each of the four racial/ethnic groups. The differences range from less than one percentage point to slightly more than three percentage points. Future Plans for the Ph.D. Completion Project CGS plans to publish one additional report based on the quantitative data from Phase I of the Ph.D. Completion Project. This publication will focus on exit surveys collected both from students who complete their programs and from those who do not. Further publications will report on self-assessments and interventions being implemented by the participating institutions. Phase II of the Ph.D. Completion Project, with continued funding from Pfizer Inc and the Ford Foundation, is now underway. The purpose of the second phase is to evaluate the specific impact on Ph.D. completion and attrition of the policies and activities now being put into effect as a part of this project. During this phase, four additional years of completion and attrition data will be provided by the participating institutions. A final project publication, planned for 2010, will include a comprehensive analysis of the quantitative and qualitative data submitted by the partnering universities in both phases, as well as a comprehensive description of those policies and practices that appear to have had a demonstrated effect on completion rates and attrition patterns over time. More detailed information about the Ph.D. Completion Project, including a full list of research and project partners for both phases, is available on the project website at www.phdcompletion.org. 4

