Scotia Private Real Estate Income Pool
As of March 31, 2015
Investment Objective
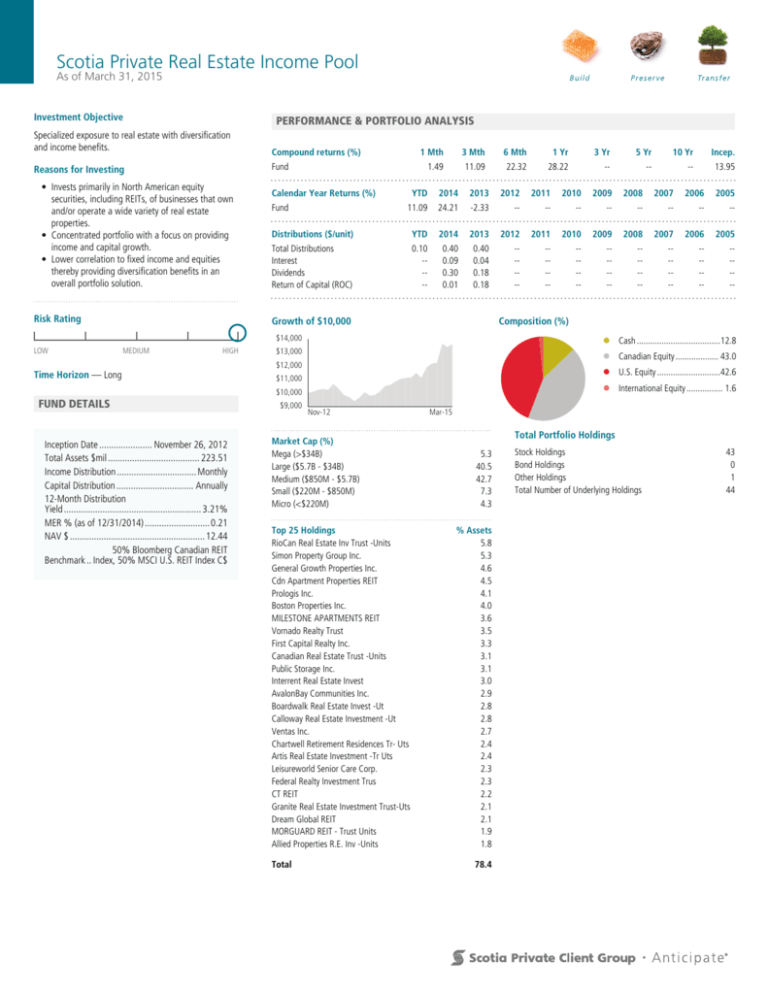
PERFORMANCE & PORTFOLIO ANALYSIS
Specialized exposure to real estate with diversification
and income benefits.
• Invests primarily in North American equity
securities, including REITs, of businesses that own
and/or operate a wide variety of real estate
properties.
• Concentrated portfolio with a focus on providing
income and capital growth.
• Lower correlation to fixed income and equities
thereby providing diversification benefits in an
overall portfolio solution.
Risk Rating
LOW
MEDIUM
Compound returns (%)
Fund
Reasons for Investing
»
HIGH
Time Horizon — Long
FUND DETAILS
Inception Date ...................... November 26, 2012
Total Assets $mil ...................................... 223.51
Income Distribution ................................. Monthly
Capital Distribution ................................ Annually
12-Month Distribution
Yield ......................................................... 3.21%
MER % (as of 12/31/2014) ........................... 0.21
NAV $ ........................................................ 12.44
50% Bloomberg Canadian REIT
Benchmark .. Index, 50% MSCI U.S. REIT Index C$
Calendar Year Returns (%)
1 Mth
3 Mth
6 Mth
1 Yr
3 Yr
5 Yr
10 Yr
Incep.
1.49
11.09
22.32
28.22
--
--
--
13.95
YTD
2014
2013
2012
2011
2010
2009
2008
2007
2006
2005
11.09
24.21
-2.33
--
--
--
--
--
--
--
--
Distributions ($/unit)
YTD
2014
2013
2012
2011
2010
2009
2008
2007
2006
2005
Total Distributions
Interest
Dividends
Return of Capital (ROC)
0.10
----
0.40
0.09
0.30
0.01
0.40
0.04
0.18
0.18
-----
-----
-----
-----
-----
-----
-----
-----
Fund
Growth of $10,000
Composition (%)
$14,000
Cash .....................................12.8
$13,000
Canadian Equity ................... 43.0
$12,000
U.S. Equity ............................42.6
$11,000
International Equity ................ 1.6
$10,000
$9,000
Nov-12
Market Cap (%)
Mega (>$34B)
Large ($5.7B - $34B)
Medium ($850M - $5.7B)
Small ($220M - $850M)
Micro (<$220M)
Top 25 Holdings
RioCan Real Estate Inv Trust -Units
Simon Property Group Inc.
General Growth Properties Inc.
Cdn Apartment Properties REIT
Prologis Inc.
Boston Properties Inc.
MILESTONE APARTMENTS REIT
Vornado Realty Trust
First Capital Realty Inc.
Canadian Real Estate Trust -Units
Public Storage Inc.
Interrent Real Estate Invest
AvalonBay Communities Inc.
Boardwalk Real Estate Invest -Ut
Calloway Real Estate Investment -Ut
Ventas Inc.
Chartwell Retirement Residences Tr- Uts
Artis Real Estate Investment -Tr Uts
Leisureworld Senior Care Corp.
Federal Realty Investment Trus
CT REIT
Granite Real Estate Investment Trust-Uts
Dream Global REIT
MORGUARD REIT - Trust Units
Allied Properties R.E. Inv -Units
Total
Mar-15
Total Portfolio Holdings
5.3
40.5
42.7
7.3
4.3
% Assets
5.8
5.3
4.6
4.5
4.1
4.0
3.6
3.5
3.3
3.1
3.1
3.0
2.9
2.8
2.8
2.7
2.4
2.4
2.3
2.3
2.2
2.1
2.1
1.9
1.8
78.4
Stock Holdings
Bond Holdings
Other Holdings
Total Number of Underlying Holdings
43
0
1
44
Scotia Private Real Estate Income Pool
MANAGER BIO
Oscar Belaiche
Manager Since November 20, 2012
1832 Asset Management L.P
Oscar is Senior Vice President & Portfolio Manager at 1832
Asset Management L.P. He joined 1832 Asset
Management L.P in 1997 and currently heads Dynamic’s
awardwinning Equity Income team, managing over $8.0
billion in assets. Oscar graduated in 1980 with an Honours
B.A. in Business Administration from the University of
Western Ontario. He has his Chartered Financial Analyst
designation and is a Fellow of the Institute of Canadian
Bankers.
Tom Dicker
Manager Since November 20, 2012
1832 Asset Management L.P.
Tom Dicker is a Portfolio Manager and member of the
award winning Equity Income team at 1832 Asset
Management LP. He is the co-manager of the Scotia
Private Real Estate Income Pool with a focus on finding
best-in-class businesses among securities in the real estate
sector.
QUARTERLY COMMENTARY
As of March 31, 2015
Global equity markets posted gains during the period. Within North America, the Canadian equity market was stronger
than the U.S., despite the drag from the energy and financial sectors. While concerns over a slowdown in the Canadian
economy weighed on bank stocks, real estate securities outperformed most sectors as a result of strong performance early
in the period, while the retail and industrial subsectors were the top performers. In the U.S., real estate securities
performed well but to a lesser extent than Canadian ones. In the U.S., the residential and office subsectors were the top
performers while hotel and resort securities were negative.
The fund’s cash weighting was held relatively steady during the period. The fund’s slight overweight towards the U.S. was
reduced with the allocation to Canada and the U.S. becoming balanced, while a small portion remained invested globally.
From a sector perspective, retail, residential and specialized Real Estate Investment Trusts (REITs) remained the largest
weightings in the fund at the end of the period. Within Canada, the fund added to residential and industrial REITs while
moderately decreasing retail exposure. In the U.S., industrial exposure was increased and the allocation to specialized
holdings reduced. Geographically, U.S. holdings were the largest contributor to performance, with Canadian holdings also
having a positive contribution to performance. Notable individual contributors included Simon Property Group, Canadian
Apartment Properties REIT and Boston Properties while Morguard REIT was the largest detractor.
Interest rates remain incredibly low from a historical perspective and we believe that a lack of inflationary pressure and a
slow, but positive, growth environment is likely to keep rates lower for longer. We believe this is an ideal setting for real
estate investing and continue to focus on companies with high quality properties, attractive yields and pricing power to
increase rents. In Canada, we continue to find opportunities in sectors with favourable supply and demand fundamentals.
In the U.S., we remain positive on the outlook for real estate securities given strong job growth and favorable supply
conditions. At the end of the period, the fund’s U.S. dollar currency exposure was unhedged but we remain open to
hedging should our fundamental views change.
Tom has over 8 years of investment industry experience,
initially as an analyst and then portfolio manager, with
LDIC Inc. As an analyst he performed fundamental analysis
focused on diversified Canadian equities. As a portfolio
manager he was responsible for the management of equity
and income-oriented funds.
Tom received an Honours Bachelor of Commerce Degree
from the University of Ottawa and holds the Chartered
Financial Analyst designation.
® Registered trademarks of The Bank of Nova Scotia, used under licence.
© Copyright 2015, 1832 Asset Management L.P. All rights reserved.
Scotia Private Client Group®consists of private client services offered by The Bank of Nova Scotia, The Bank of Nova Scotia Trust Company, 1832 Asset Management L.P., 1832 Asset
Management U.S. Inc., ScotiaMcLeod Financial Services Inc., WaterStreet Family Offices®, a division of 1832 Asset Management L.P., and ScotiaMcLeod®, a division of Scotia Capital Inc.
Scotia Capital Inc. is a member of the Canadian Investor Protection Fund and the Investment Industry Regulatory Organization of Canada.
Scotia Private Pools® are managed by 1832 Asset Management L.P., a limited partnership the general partner of which is wholly owned by The Bank of Nova Scotia.
Units of the fund are only available for distribution to residents of Canada, unless the laws of a foreign jurisdiction permit sales to its residents.
IMPORTANT MUTUAL FUND INFORMATION
Important information about the Scotia Private Pools is contained in their simplified prospectus. Commissions, trailing commissions, management fees
and expenses may be associated with mutual fund investments. Please read the prospectus before investing. Mutual funds are not guaranteed or insured
by the Canada Deposit Insurance Corporation or any other government deposit insurer, their values change frequently and past performance may not be
repeated. The indicated rates of return are the historical annual compounded total returns including changes in unit value and reinvestment of all
distributions and does not take into account sales, redemption, distribution or optional charges or incomes taxes payable by any security holder that
would have reduced return.


