BSNL: Obstacles for Its Development & Its Solution
advertisement
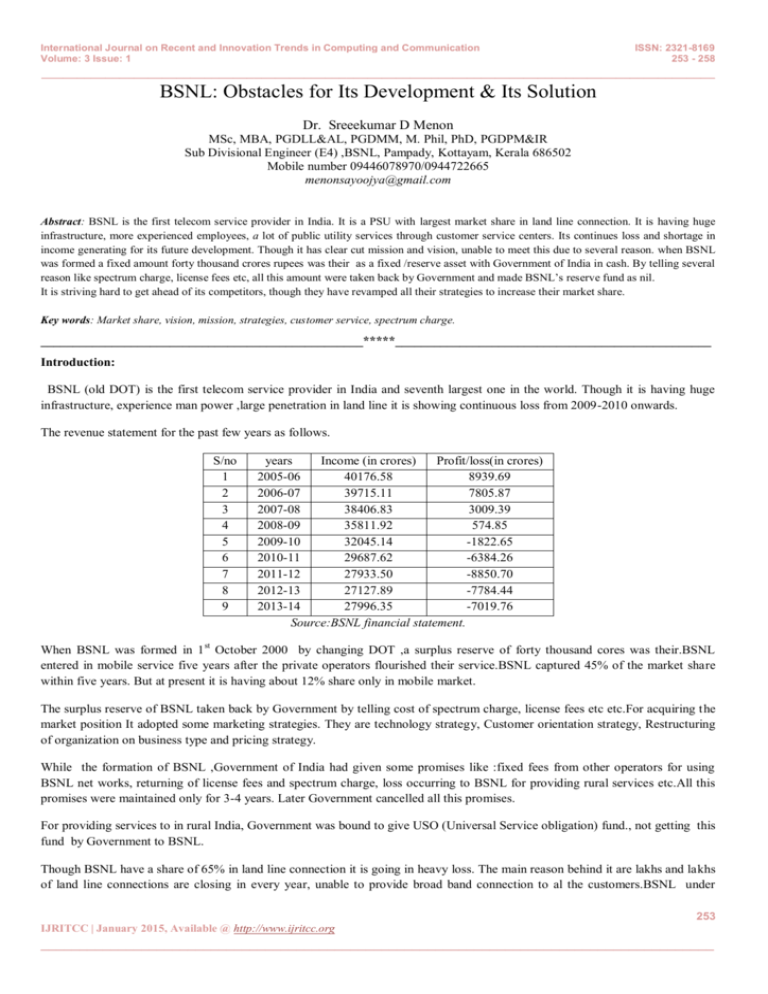
International Journal on Recent and Innovation Trends in Computing and Communication Volume: 3 Issue: 1 ISSN: 2321-8169 253 - 258 _______________________________________________________________________________________________ BSNL: Obstacles for Its Development & Its Solution Dr. Sreeekumar D Menon MSc, MBA, PGDLL&AL, PGDMM, M. Phil, PhD, PGDPM&IR Sub Divisional Engineer (E4) ,BSNL, Pampady, Kottayam, Kerala 686502 Mobile number 09446078970/0944722665 menonsayoojya@gmail.com Abstract: BSNL is the first telecom service provider in India. It is a PSU with largest market share in land line connection. It is having huge infrastructure, more experienced employees, a lot of public utility services through customer service centers. Its continues loss and shortage in income generating for its future development. Though it has clear cut mission and vision, unable to meet this due to several reason. when BSNL was formed a fixed amount forty thousand crores rupees was their as a fixed /reserve asset with Government of India in cash. By telling several reason like spectrum charge, license fees etc, all this amount were taken back by Government and made BSNL’s reserve fund as nil. It is striving hard to get ahead of its competitors, though they have revamped all their strategies to increase their market share. Key words: Market share, vision, mission, strategies, customer service, spectrum charge. __________________________________________________*****_________________________________________________ Introduction: BSNL (old DOT) is the first telecom service provider in India and seventh largest one in the world. Though it is having huge infrastructure, experience man power ,large penetration in land line it is showing continuous loss from 2009-2010 onwards. The revenue statement for the past few years as follows. S/no 1 2 3 4 5 6 7 8 9 years Income (in crores) Profit/loss(in crores) 2005-06 40176.58 8939.69 2006-07 39715.11 7805.87 2007-08 38406.83 3009.39 2008-09 35811.92 574.85 2009-10 32045.14 -1822.65 2010-11 29687.62 -6384.26 2011-12 27933.50 -8850.70 2012-13 27127.89 -7784.44 2013-14 27996.35 -7019.76 Source:BSNL financial statement. When BSNL was formed in 1 st October 2000 by changing DOT ,a surplus reserve of forty thousand cores was their.BSNL entered in mobile service five years after the private operators flourished their service.BSNL captured 45% of the market share within five years. But at present it is having about 12% share only in mobile market. The surplus reserve of BSNL taken back by Government by telling cost of spectrum charge, license fees etc etc.For acquiring the market position It adopted some marketing strategies. They are technology strategy, Customer orientation strategy, Restructuring of organization on business type and pricing strategy. While the formation of BSNL ,Government of India had given some promises like :fixed fees from other operators for using BSNL net works, returning of license fees and spectrum charge, loss occurring to BSNL for providing rural services etc.All this promises were maintained only for 3-4 years. Later Government cancelled all this promises. For providing services to in rural India, Government was bound to give USO (Universal Service obligation) fund., not getting this fund by Government to BSNL. Though BSNL have a share of 65% in land line connection it is going in heavy loss. The main reason behind it are lakhs and lakhs of land line connections are closing in every year, unable to provide broad band connection to al the customers.BSNL under 253 IJRITCC | January 2015, Available @ http://www.ijritcc.org _______________________________________________________________________________________ International Journal on Recent and Innovation Trends in Computing and Communication Volume: 3 Issue: 1 ISSN: 2321-8169 253 - 258 _______________________________________________________________________________________________ ground cables were damaging by PWD/water authority/local body authority etc.Unable to take a strong decision against this destruction by the BSNL management. The ITS officers of the top management is still in deemed deputation in BSNL.Because of this an effective management is not available in BSNL. In order to make BSNL a profitable company, Sam Pitroda committee forwarded some proposal in few years before. The proposal was not implemented due to heavy opposition from their staff unions. Unlike the private companies, the Government owned BSNL could not implement the strategies so easily because they have a lot of protocols to be followed .This delay make many good things from reaching people. There are also situations even after the completion of all the protocols successfully, they may fail to implement the plan because of opposition from the employees unions. Government is going ahead with for privatizing BSNL in several ways like selling share, infrastructure sharing, and forming separate company etc.The telecom policy of 2012 is aimed to help private operators and destroy the PSU. Since GOI research wing failed to produce modern technology telecom equipment, BSNL bound to procure this items from out side. This is forcing BSNL to procure software from outside and bound to give patent for the soft ware also. Though Government owned ITI and BSNL equipment manufacturing factories are their ,Government not taking any interest for their upliftment. When mobile services were started in India by private operators, high tariff was their for incoming and outgoing calls. When BNL started this service the high calling rates and incoming calls charging were stopped and ordinary people got mobile services in reasonable rates. In order to overcome the present crisis BSNL have to re think for a new strategy. Some of the strategies planned but not implemented. GOI have to give financial assistance to BSNL .Whatever the amount taken from BSNL by way of spectrum charge, license fees etc to be returned. Instruct all PSUs to take services from BSNL&MTNL.Needy equipments to be purchased for the development work of BSNL,The non profitable rural service loss to be compensated by giving additional fund. No spectrum charge and license fees to be recovered from BSNL for at least for the forth coming 3-4 years. Appoint more staffs for running the service properly. Following strategies to be implemented by BSNL for its development and revoke from its crisis. 1) Sam Pitroda committee observed that about 50% of BSNL income is utilizing for employees salary. To reduce this VRS to be implemented for one lakh employees. 2) In order to raise fund either government should give fund or 30% of the strategic stake sale to be initiated. 3) Customer orientation strategies to be formulated to retain existing customers and attract new customers. 4) Marketing strategy to be formulated so that service to be provided at door step, introducing flexible registrations terms so that new customers are attracted. Educating the customers about services in details and respective tariff structures. 5) Creating a service oriented culture within the organization by linking incentive satisfaction. Better performance monitoring, out put oriented /out put based salary and incentive to be given to employees. 6) No direct payment should be done by BSNL for medical treatment to staffs. It should be given by tie up with some government owned insurance companies. 7) Business diversifications to be launched for the survival of the organization. In training centers engineering courses to be started. In free lands multistoried building to be constructed and giving on leased /rental basis.etc Objectives of the study: The main objective of the study is how to achieve mission and vision of BSNL by adopting the new market strategies. Other objectives are 1) To be the leading telecom service provider in India by achieving higher rate of growth so as to become a profitable enterprise. 2) To provide quality and reliable fixed telecom service to our customers and there by increases customers confidence. 3) To provide customer friendly mobile telephone service of high quality in its area of operation. 254 IJRITCC | January 2015, Available @ http://www.ijritcc.org _______________________________________________________________________________________ International Journal on Recent and Innovation Trends in Computing and Communication Volume: 3 Issue: 1 ISSN: 2321-8169 253 - 258 _______________________________________________________________________________________________ Research Methodology: The study is based on both primary and secondary data. Response of the BSNL employees is taken as the primary data.SPSS is used for the analysis. SWOT Analysis of BSNL : Strength : Service in rural areas, experienced telecom service provider, total telecom service provider and huge infrastructure. Weakness: Poor market strategy, huge and aged manpower, social obligations and political interference. Opportunity: Tremendous market growth rate of 20 lakhs customers per month. Under tapped BB services. Threats: Competitions from private operators, high bargaining power of customers, policies of government, Lack of support from Government and top management is not the part of BSNL. Hypotheses: 1. 2. 3. 4. There is no significance for implementing VRS as per Sam pitroda panel package as 50% of the BSNL income spending for paying salaries to staff. There is no significance to achieve mission and vision of BSNL without implementing the marketing strategies. There is no significance to achieve higher rate of growth so as to become a profitable enterprise. There is no significance to increase customer confidence by providing quality and fixed reliable telecom service. Analysis: Table-1: Classification based on Age Frequency Percent 20 - 30 Years 0 0.0 31 - 40 Years 5 5.0 41 - 50 Years 32 32.0 51 - 60 Years 63 63.0 Total 100 100.0 This table shows that 63% of the sample belongs to the age group 51-60 years and 32% of the sample belongs to the age group 4150 years. Only 5% of the sample belongs to the age group 31-40 years and none of them belongs to the group 20-30 years. Table-2: Classification based on Sex of the participants Frequency Percent Male 69 69.0 Female 31 31.0 Total 100 100.0 From this table, it is clear that 69% of the sample is male respondents and the rest of the sample is female respondents. Table-3: Classification based on Marital Status Frequency Percent 255 IJRITCC | January 2015, Available @ http://www.ijritcc.org _______________________________________________________________________________________ International Journal on Recent and Innovation Trends in Computing and Communication Volume: 3 Issue: 1 ISSN: 2321-8169 253 - 258 _______________________________________________________________________________________________ Single 92 92.0 Married 7 7.0 Divorced 1 1.0 Widow/Widower 0 0.0 100 100.0 Total This table reveals that majority (92%) of the respondents is single and almost 7% of the sample has married. Only 1% of the sample has divorced and none of the respondents has widowed. Table-4: Classification based on of Number of Dependents in the Family Frequency Percent 1-2 7 7.0 3-4 30 30.0 >4 63 63.0 Total 100 100.0 This table shows that majority (63%) of the sample has more than four dependents in the family and 30% of them have 3-4 dependents. Only 7% of the respondents have 1-2 dependents in the family. Table-5: Classification based on Working Experience Frequency Percent Up to 10 Years 3 3.0 11 - 20 Years 7 7.0 21 - 30 Years 78 78.0 Above 30 Years 12 12.0 Total 100 100.0 From this table, it is clear that 78% of the sample has a work experience of 21-30 years and 12% of the sample has a work experience of above 30 years. Only 7% of the respondents have an experience of 11-20 years and 3% of them have below 10 years of experience. Table-6: Classification based on Educational Qualification Frequency Percent Up to SSLC 58 58.0 +2/ITI/Diploma 16 16.0 Degree 11 11.0 PG and Above 15 15.0 Total 100 100.0 This table shows that 58% of the sample has educated up to SSLC and 16% of the sample has an educational qualification of +2/ITI/diploma. Only 11% of the respondents have graduated and 15% of them qualified PG or above. Table-7: Opinion about achieving of mission and vision of BSNL 256 IJRITCC | January 2015, Available @ http://www.ijritcc.org _______________________________________________________________________________________ International Journal on Recent and Innovation Trends in Computing and Communication Volume: 3 Issue: 1 ISSN: 2321-8169 253 - 258 _______________________________________________________________________________________________ Frequency Percent Strongly Agree 76 76.0 Agree No Opinion / Neutral Disagree Strongly Disagree 24 24.0 0 0.0 0 0.0 0 0.0 Chi-square p - value 27.040 0.000 Here, majority of the respondents (76%) have strong opinion about achieving mission and vision of BSNL and 24% have agree that opinion. None of the sample responded against this particular opinion. Since the p-value is less than the significant level 0.05, we can conclude that the positive opinion about achieving the mission and vision of BSNL is significant. Table-8: Opinion about achieving higher growth rate to become a profitable business Frequency Percent Strongly Agree 81 81.0 Agree 12 12.0 No Opinion / Neutral 6 6.0 Disagree 1 1.0 Strongly Disagree 0 0.0 Chi-square p - value 169.680 0.000 This table shows that majority of the respondents (81%) have strong opinion about achieving higher growth rate to become a profitable business and 12% have agree that opinion. 6% of the sample have no opinion and only 1% have strongly disagree that opinion. Since the p-value is less than the significant level 0.05, we can conclude that the positive opinion about achieving higher growth rate to become a profitable business is significant. Table-9 :Openion about providing quality and reliable sevices to customers and increase the confidence Frequency Percent Strongly Agree 82 82.0 Agree 16 16.0 No Opinion / Neutral 2 2.0 Disagree 0 0.0 Strongly Disagree 0 0.0 Chi-square p - value 109.520 0.000 From this table, it is clear that 82% of the respondents have strong opinion about providing quality and reliable services to customers and 16% have agree that opinion. Only 2% of the sample has no opinion about providing quality and reliable services to customers. Since the p-value is less than the significant level 0.05, we can conclude that the positive opinion about providing quality and reliable services to customers is significant. Table-11: Opinion about implementing of VRS Frequency Percent Strongly Agree 30 30.0 Agree 0 0.0 No Opinion / Neutral 5 5.0 Disagree 27 27.0 Strongly Disagree 38 38.0 Chi-square p - value 23.920 0.000 257 IJRITCC | January 2015, Available @ http://www.ijritcc.org _______________________________________________________________________________________ International Journal on Recent and Innovation Trends in Computing and Communication Volume: 3 Issue: 1 ISSN: 2321-8169 253 - 258 _______________________________________________________________________________________________ This table shows that 38% of the respondents have strongly opposing the implementation of VRS and a further 27% are against implementing VRS. 30% of the respondents have strongly supporting the implementation of VRS and 5% have no opinion. Since the p-value is less than the significant level 0.05, we can conclude that the opinion about implementing of VRS is significant and majority of the respondents are against implementing VRS. The graphical representation of the opinion about implementing VRS is given below. 2% stands neutral. Since the p-value is less than the significant level 0.05, we can conclude that the positive opinion about providing BSNL service at door steps to customers, educating about service details, tariffs etc. is significant. Findings: 1) 2) 3) 4) 5) 6) Majority of the employees (61%) are in the age group of 51-60 years &32% belongs to the age group of 41-50 years. Majority of the employees are male. Majority have the working experience of 20-30 years. All of the employees wants to achieve mission and vision of BSNL. Majority of the employees wants to provide a reliable service and win the confidence of the customers. Majority of the employees against implementing VRS in BSNL. Suggestions: BSNL authorities have to think about the following to recover from the crisis it is facing at present. 1) It has to start Diversification like converting training centers to Engineering colleges/management institutes, give vacant space and bear lands on rental/leased basis, manufacturing of EPBTs etc. 2) Immediate stopping of medical allowances of all staffs and tie up it with some Government insurance companies or agencies like MOU for taking loan from Canara Bank in low rate etc. 3) Try to implement performance/output based salary in all cadres and fix target in the field of their work. This will help BSNL to achieve its target in provision of connection, clearing of faults in time etc.If the supervisor for the above work is an outsider it will be good. 4) Since customers have a faith in BSNL, market it by providing services at door step and educate them about by comparing with others services. 5) Instead of implementing DCRMS in Kerala alone ,give AMC for out door plant with TRAIs terms and conditions. This will help the BSNL for independency from petty contract workers as it is a major issue faced by BSNL in out door maintenance. 6) Increase the land line tariff and free calls and maintain the connection without providing instrument, as a lot of amount spending by BSNL for reparing the outdated phone and purchasing of new phones. Conclusion: BSNL is the seventh largest telecom company in the world facing a lot of problems/menace for its existences. If a drastic change make from top to bottom of the company, it can be improve by reaching its olden years of profitable making company. References: [1] 1)TRAI site [2] BSNL site 258 IJRITCC | January 2015, Available @ http://www.ijritcc.org _______________________________________________________________________________________

