The Graph Scale-Change Theorem
advertisement
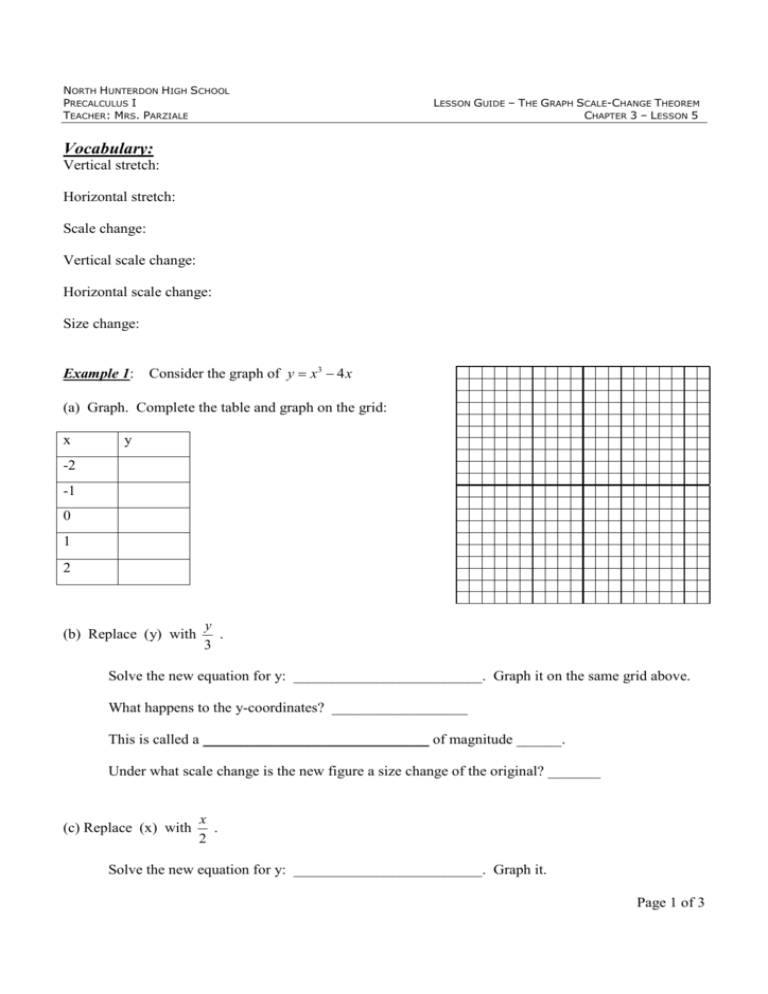
NORTH HUNTERDON HIGH SCHOOL PRECALCULUS I TEACHER: MRS. PARZIALE LESSON GUIDE – THE GRAPH SCALE-CHANGE THEOREM CHAPTER 3 – LESSON 5 Vocabulary: Vertical stretch: Horizontal stretch: Scale change: Vertical scale change: Horizontal scale change: Size change: Example 1: Consider the graph of y = x3 − 4 x (a) Graph. Complete the table and graph on the grid: x y -2 -1 0 1 2 (b) Replace (y) with y . 3 Solve the new equation for y: _________________________. Graph it on the same grid above. What happens to the y-coordinates? __________________ This is called a ______________________________ of magnitude ______. Under what scale change is the new figure a size change of the original? _______ (c) Replace (x) with x . 2 Solve the new equation for y: _________________________. Graph it. Page 1 of 3 NORTH HUNTERDON HIGH SCHOOL PRECALCULUS I TEACHER: MRS. PARZIALE LESSON GUIDE – THE GRAPH SCALE-CHANGE THEOREM CHAPTER 3 – LESSON 5 What happens to the x-coordinates? __________________ This is called a _________________________________ of magnitude ______. Under what scale change is the new figure a size change of the original? _______ (d) Let f ( x) = x3 − 4 x . Find an equation for g(x), the image of f(x) under S ( x, y ) → (2 x,3 y ) . First – look at the next theorem: Graph Scale-Change Theorem: In a relation described by a sentence in (x) and (y), the following two processes yield the same graph: (1) replace (x) by _____________ and (y) by ____________ in the sentence (2) apply the scale change __________________ to the graph of the original relation. Note: If a = b, then you have performed a ________________________________. Now, write the equation of the transformed function. Page 2 of 3 NORTH HUNTERDON HIGH SCHOOL PRECALCULUS I TEACHER: MRS. PARZIALE LESSON GUIDE – THE GRAPH SCALE-CHANGE THEOREM CHAPTER 3 – LESSON 5 x Example 2: Consider y = x . Find an equation for the function under S ( x, y ) → , −2 y 3 x Consider y = x under the scale change S ( x, y ) → , −2 y 3 Describe what happens to all of the x values: Describe what happens to all of the y values: Find the equation for the transformed image by Replace (x) with ______________ Replace (y) with ______________ Now make the new equation (remember to simplify to y= form): x Example 3: The graph to the right is y = f(x). Draw 3 y = f ( ) . 4 What should happen to all of the x values? What should happen to all of the y values? Page 3 of 3

