The Graph Scale-Change Theorem
advertisement
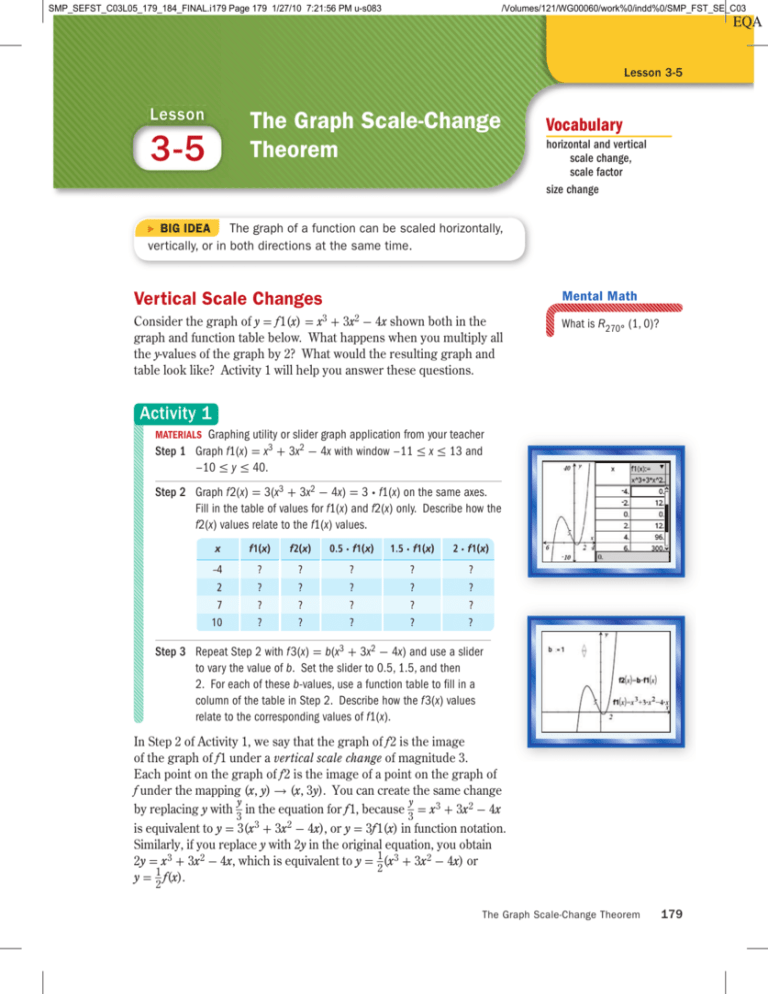
SMP_SEFST_C03L05_179_184_FINAL.i179 Page 179 1/27/10 7:21:56 PM u-s083 /Volumes/121/WG00060/work%0/indd%0/SMP_FST_SE_C03 Lesson 3-5 Lesson The Graph Scale-Change Theorem 3-5 Vocabulary horizontal and vertical scale change, scale factor size change BIG IDEA The graph of a function can be scaled horizontally, vertically, or in both directions at the same time. Vertical Scale Changes Mental Math Consider the graph of y = f 1(x) = x3 + 3x2 - 4x shown both in the graph and function table below. What happens when you multiply all the y-values of the graph by 2? What would the resulting graph and table look like? Activity 1 will help you answer these questions. What is R270° (1, 0)? Activity 1 MATERIALS Graphing utility or slider graph application from your teacher Step 1 Graph f1(x) = x3 + 3x2 - 4x with window -11 ≤ x ≤ 13 and -10 ≤ y ≤ 40. Step 2 Graph f2(x) = 3(x3 + 3x2 - 4x) = 3 · f1(x) on the same axes. Fill in the table of values for f1(x) and f2(x) only. Describe how the f2(x) values relate to the f1(x) values. x f1(x) f2(x) 0.5 · f1(x) 1.5 · f1(x) 2 · f1(x) –4 ? ? ? ? ? 2 ? ? ? ? ? 7 ? ? ? ? ? 10 ? ? ? ? ? Step 3 Repeat Step 2 with f 3(x) = b(x3 + 3x2 - 4x) and use a slider to vary the value of b. Set the slider to 0.5, 1.5, and then 2. For each of these b-values, use a function table to fill in a column of the table in Step 2. Describe how the f3(x) values relate to the corresponding values of f1(x). In Step 2 of Activity 1, we say that the graph of f 2 is the image of the graph of f 1 under a vertical scale change of magnitude 3. Each point on the graph of f 2 is the image of a point on the graph of f under the mapping (x, y) → (x, 3y). You can create the same change y y by replacing y with _ in the equation for f 1, because _ = x 3 + 3x 2 - 4x 3 3 is equivalent to y = 3(x 3 + 3x 2 - 4x), or y = 3f 1(x) in function notation. Similarly, if you replace y with 2y in the original equation, you obtain 2y = x 3 + 3x 2 - 4x, which is equivalent to y = _1 (x 3 + 3x 2 - 4x) or 2 y = _1 f(x). 2 The Graph Scale-Change Theorem 179 Chapter 3 QY QY Horizontal Scale Changes Replacing the variable y by ky in an equation results in a vertical scale change. What happens when the variable x is replaced by _x ? By 4x? 2 y Replacing y by _4 in the equation for f1 yields an equation equivalent to y = ? . What is the effect on the graph of f ? Activity 2 MATERIALS Graphing utility or slider graph application provided by your teacher. Step 1 Consider the graph of f1 in Activity 1. Complete the table at the right. x f1(x) –4 –1 2 ? ? ? x x x x Step 2 If f 4(x) = f1(_a ), then f 4(x) = (_a )3 + 3(_a )2 - 4(_a ). Graph f 4 and use a slider to vary the value of a. Step 3 a. What are the x- and y-intercepts of f1? b.How do the intercepts of f4 change as a changes? The graph of f4 in Activity 2 is the image of the graph of f 1 under a horizontal scale change of magnitude a. Each point on the graph of f4 is the image of a point on the graph of f 1 under the mapping (x, y) → (ax, y). Replacing x by _x in the equation doubles the x-values of 2 the preimage points while the corresponding y-values remain the same. Accordingly, the x-intercepts of the image are two times as far from the y-axis as the x-intercepts of the preimage. The Graph Scale-Change Theorem In general, a scale change centered at the origin with horizontal scale factor a ≠ 0 and vertical scale factor b ≠ 0 is a transformation that maps (x, y) to (ax, by). The scale change S can be described by S: (x, y) → (ax, by) or S(x, y) = (ax, by). If a = 1 and b ≠ 1, then the scale change is a vertical scale change. If b = 1 and a ≠ 1, then the scale change is a horizontal scale change. When a = b, the scale change is called a size change. Notice that in the preceding instances, replacing x by _x in an equation for a function results 2 y in the scale change S: (x, y) → (2x, y); and replacing y by _ leads to the 3 scale change S: (x, y) → (x, 3y). These results generalize. 180 Transformations of Graphs and Data SMP_SEFST_C03L05_179_184_FINAL.i180 180 4/23/09 1:32:37 PM Lesson 3-5 Graph Scale-Change Theorem Given a preimage graph described by a sentence in x and y, the following two processes yield the same image graph: y (1) replacing x by _ax and y by _b in the sentence; (2) applying the scale change (x, y) → (ax, by) to the preimage graph. Proof Name the image point (x, y). So x = ax and y = by. Solving for x and y y y x _ _ _x gives _ a = x and b = y. The image of y = f(x) will be a = f( a ). The image equation is written without the primes. Unlike translations, scale changes do not produce congruent images unless a = b = 1. Notice also that multiplication in the scale change corresponds to division in the equation of the image. This is analogous to the Graph-Translation Theorem in Lesson 3-2, where addition in the translation (x, y) → (x + h, y + k) corresponds to subtraction in the image equation y - k = f(x - h). GUIDED Example 1 The relation described by x2 + y2 = 25 is graphed at the right. a. Find images of points labeled A–F on the graph under S: (x, y) → (2x, y). b. Copy the circle onto graph paper; then graph the image on the same axes. c. Write an equation for the image relation. D (0, 5) E (-3, 4) y C (3, 4) 4 2 B (4, 3) x A (5, 0) -5 5 -2 Solution F (4, -3) -4 a. Copy and complete the table below. b. Plot the preimage and image points on graph paper and draw a smooth curve connecting the image points. A partial graph is drawn below. c. According to the Graph Scale-Change Theorem, an equation for an image under S: (x, y) → (2x, y) can be found by replacing x by ? in the equation for the preimage. The result is the equation ? . Preimage Image y Point x y 2x y A 5 0 10 0 B ? ? ? ? ? ? ? ? ? ? ? ? ? ? ? ? ? ? ? ? C D E F 5 B (4, 3) -10 A (5, 0) 5 -5 B' (8, 3) A' (10, 0) x 10 -5 The Graph Scale-Change Theorem SMP_SEFST_C03L05_179_184_FINAL.i181 181 181 4/23/09 1:32:54 PM SMP_SEFST_C03L05_179_184_FINAL.i182 Page 182 1/27/10 7:22:11 PM u-s083 /Volumes/121/WG00060/work%0/indd%0/SMP_FST_SE_C03 Chapter 3 Example 2 y A graph and table for y = f(x) are given at the right. y Draw the graph of _ 3 = f(2x). 8 x f(x) –6 –3 0 2 6 2 –1 –1 3 0 y y x Solution Rewrite _3 = f(2x) as _3 = f _ _1 . By the Graph Scale-Change 2 x _y is the same as applying the scale Theorem, replacing x by _ and y by _1 3 () 6 4 A y = f(x) -6 -4 2 -2 B -2 4 Ex 6 C -4 2 ( 2 ) 1 change (x, y) → _2 x, 3y . y A = (–6, 2) ⇒ (–3, 6) = A So, D D' 8 B = (–3, –1) ⇒ (–3/2, –3) = B A' 6 C = (0, –1) ⇒ (0, –3) = C 4 D = (2, 3) ⇒ (1, 9) = D and Negative Scale Factors Notice what happens when a scale factor is –1. Consider the horizontal and vertical scale changes H and V with scale factors equal to –1. H: (x, y) → (–x, y) and V: (x, y) → (x, –y) In H, each x-value is replaced by its opposite, which produces a reflection over the y-axis. Similarly, in V, replacing y by –y produces a reflection over the x-axis. More generally, a scale factor of –k combines the effect of a scale factor of k and a reflection over the appropriate axis. Questions COVERING THE IDEAS 1. True or False Under every scale change, the preimage and image are congruent. 2. Under a scale change with horizontal scale factor a and vertical factor b, the image of (x, y) is ? . 3. Refer to the Graph Scale-Change Theorem. Why are the restrictions a ≠ 0 and b ≠ 0 necessary? 4. If S maps each point (x, y) to (_2x , 6y), give an equation for the image 182 Transformations of Graphs and Data x E' -6 -4 -2 2 -2 of y = f(x) under S. = f(2x) 2 E = (6, 0) ⇒ (3, 0) = E. The graph of the image is shown at the right. y 3 B' -4 C' 4 6 SMP_SEFST_C03L05_179_184_FINAL.i183 Page 183 1/27/10 7:22:22 PM u-s083 /Volumes/121/WG00060/work%0/indd%0/SMP_FST_SE_C03 Lesson 3-5 5. Consider the function f 1 used in Activities 1 and 2. a. Write a formula for f 1(_x ). 3 b. How is the graph of y = f 1(_x ) related to the graph of y = f 1(x)? 3 6. Multiple Choice Which of these transformations is a size change? A (x, y) → (3x, 3y) C (x, y) → (x + 3, y + 3) B (x, y) → (3x, y) D (x, y) → (_x , y) 3 y 7. Functions f and g with f(x) = –2x 2 + 5x + 3 and 8 g(x) = _1 f(x) are graphed at the right. 2 a. What scale change maps the graph of f to the graph of g? b. The x-intercepts of f are at x = – _1 and x = 3. Where are 2 the x-intercepts of g? c. How do the y-intercepts of f and g compare? d. The vertex of the graph of f is (1.25, 6.125). What is the vertex of the graph of g? 4 1 ( ) 2f x x -2 -1 1 -2 3 4 2 4 2 -6 y S(x, y) = 2x, _7 . a. Find the images of (–3, 9), (0, 0), and _1 , _1 under S. 2 4 b. Write an equation for the image of the parabola under S. ) g(x) = 2 8. Consider the parabola with equation y = x 2. Let ( f(x) = -2x2 + 5x + 3 6 ( ) 9. The graph of a function f is shown at the right. y a. Graph the image of f under S(x, y) = _1 x, 3y . 2 b. Find the x- and y-intercepts of the image. c. Find the coordinates of the point where the y-value of the image of f reaches its maximum. ( ) 4 2 x -4 10. Give another name for the horizontal scale change of -2 magnitude –1. -2 11. Describe the scale change that maps the graph of y = x _ the graph of y = . √ x onto -4 12 APPLYING THE MATHEMATICS y 12. Refer to the parabolas at the right. The graph of g is the image of the graph of f under what a. horizontal scale change? b. vertical scale change? c. size change? 13. Write an equation for the image of the graph of y = x + _1x under each transformation. a. S(x, y) = (2x, 2y) b. S(x, y) = _x , –y (3 ) 14. A scale change maps (10, 0) onto (2, 0) and (–5, 8) onto (–1, 2). What is the equation of the image of the graph of f(x) = x3 - 8 under the scale change? 16 14 12 f(x) = x2 10 8 6 (-2, 4) 4 (-8, 4) (-1, 1) 2 (- 4, 1) -8 -6 -4 -2 x 2 4 g(x) = (2, 4) (1, 1) (8, 4) (4, 1) x 2 4 6 8 The Graph Scale-Change Theorem 183 SMP_SEFST_C03L05_179_184_FINAL.i184 Page 184 1/27/10 7:22:30 PM u-s083 /Volumes/121/WG00060/work%0/indd%0/SMP_FST_SE_C03 Chapter 3 In 15 and 16, give a rule for a scale change that maps the graph of f onto the graph of g. y y 15. 16. 8 8 g(x) 6 6 4 4 2 f(x) 2 f(x) x -6 -4 -2 2 4 6 -2 -4 x -6 -4 -2 2 4 6 -2 g(x) -4 -6 -6 -8 -8 REVIEW In 17 and 18, an equation for a function is given. Is the function odd, even, or neither? If the function is odd or even, prove it. (Lesson 3-4) 17. f(x) = (5x + 4)3 18. g(x) = 5x4 + 4 19. If f(x) = –g(x) for all x in the common domain of f and g, how are the graphs of f and g related? (Lesson 3-4) 20. One of the parent functions presented in Lesson 3-1 has a graph that is not symmetric to the x-axis, y-axis, or origin. It has the asymptote y = 0. Which is it? (Lesson 3-1) 21. The table at the right shows the number of Total Children’s Rides injuries on different types of rides in amusement Family and Adult Rides parks in the U.S. in 2003, 2004, and 2005. Use Roller Coasters the table to explain whether each statement is Source: National Safety Council supported by the data. (Lesson 1-1) a. Injuries on children’s rides decreased slightly each year. b. The number of injuries on roller coasters decreased from 2003 to 2004. c. Roller coasters are not as safe as children’s rides. 22. Pizza π restaurant made 300 pizzas yesterday; 64% of the pizzas had no toppings, 10% of the pizzas had two toppings, and 26% had more than two toppings. How many pizzas had at least two toppings? (Previous Course) 2003 2004 2005 1954 277 1173 504 1648 219 806 613 1713 192 1131 390 EXPLORATION 23. a. Explore g(x) = b(x 3 + 3x 2 - 4x) for b < 0. Explain what happens to the graph of g as b changes. x 3 _x 2 _x b. Explore h(x) = (_ a ) + 3( a ) - 4( a ) for a < 0. Explain what happens to the graph of h as a changes. QY ANSWER 4(x3 + 3x2 - 4x); a vertical scale change of magnitude 4 184 Transformations of Graphs and Data

