April 17, 2014 Dear Shareholder: The following report is from Jacob
advertisement
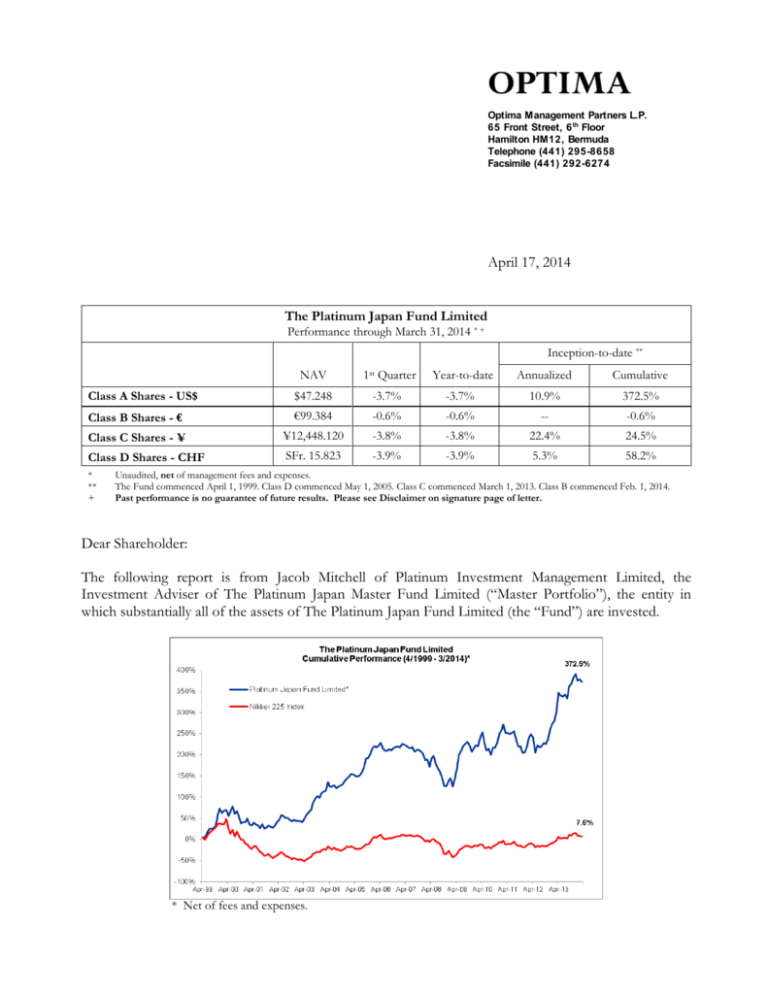
Optima Management Partners L.P. 65 Front Street, 6 th Floor Hamilton HM12, Bermuda Telephone (441) 295-8658 Facsimile (441) 292-6274 April 17, 2014 The Platinum Japan Fund Limited Performance through March 31, 2014 * + Inception-to-date ** NAV 1st Quarter Year-to-date Annualized Cumulative Class A Shares - US$ $47.248 -3.7% -3.7% 10.9% 372.5% Class B Shares - € €99.384 -0.6% -0.6% -- -0.6% Class C Shares - ¥ ¥12,448.120 -3.8% -3.8% 22.4% 24.5% Class D Shares - CHF SFr. 15.823 -3.9% -3.9% 5.3% 58.2% * ** + Unaudited, net of management fees and expenses. The Fund commenced April 1, 1999. Class D commenced May 1, 2005. Class C commenced March 1, 2013. Class B commenced Feb. 1, 2014. Past performance is no guarantee of future results. Please see Disclaimer on signature page of letter. Dear Shareholder: The following report is from Jacob Mitchell of Platinum Investment Management Limited, the Investment Adviser of The Platinum Japan Master Fund Limited (“Master Portfolio”), the entity in which substantially all of the assets of The Platinum Japan Fund Limited (the “Fund”) are invested. * Net of fees and expenses. “Portfolio Position Changes in quarterly long portfolio composition: Sector Breakdown Sector Domestic Consumer and Retail Financials Healthcare Services Telco and Utilities Property and Construction March 2014 52% 14% 12% 10% 7% 6% 3% December 2013 63% 16% 15% 9% 13% 6% 4% Export Tech/Capital Equipment Durables Commodities 42% 21% 15% 6% 39% 22% 14% 3% Gross Long Exposure 94% 102% Source: Platinum / Optima Disposition of Assets Region Japan Korea Cash Shorts * Source: Platinum / Optima March 2014 87% 7% 6% -13% December 2013 93% 9% -2% -22% * Shorts in March 2014 included a -8% Japanese Government Bond future position, a -2% Nikkei future and a -3% Topix Real Estate Index. Shorts in December 2013 included a -9% Japanese Government Bond future position, a -8% Nikkei future and a -2% Topix Real Estate Index. Some themes that are represented prominently within the Fund include: - Emergent industrials with leading global positions. - Corporate revitalisation, industry reorganisation and potential merger and acquisition targets. - Potential beneficiaries of policy change (e.g. industry deregulation, labor market reform, tax reform, new business incubation incentives). - Internet 2.0 and service sector growth opportunities. - Emergent energy management opportunities (smart cities/grids, smart buildings). - Cheap real asset exposures that domestic investors will seek as inflation hedges. 2 Performance (compound pa) Platinum Japan Fund Limited MSCI Japan Index Source: Platinum and MSCI Quarter 1 yr 3 yrs 5 yrs -3.7% -5.6% 17.3% 7.5% 10.4% 5.4% 14.1% 10.4% Since Inception 10.9% 1.6% The Japanese market experienced a poor quarter, best described as indigestion, with record inflows from foreigners over the past 12 months leaving the market vulnerable to perceived policy disappointments. Some express disappointment that the Bank of Japan (BOJ) is not pre-emptively easing prior to the 1 April consumption tax rise (from 5% to 8%), whilst others are just losing patience with the apparent slowness of Abe’s so called “Third Arrow” reforms. Our interpretation, given the large move over the prior 12 months, is that many investors are just looking for an excuse to sell the market. The weakness in the market was also felt broadly across our portfolio with only a few exceptions, though our index and individual stock shorts did provide some protection, as did a higher weighting in the yen. Importantly, portfolio hedging strategies (via individual stock and index shorts, and currency hedging) have generated just over a quarter of the Fund’s total returns over the past six years, with our long stock picking generating the residual. In practice we do not see these as separate strategies, but as one interrelated approach where the macro and stock/industry specific work is inextricably linked. Changes to the Portfolio There was some turnover in the portfolio as we attempted to concentrate on higher conviction ideas. This meant selling stocks that had reached valuation levels which made them less interesting as investments (e.g. Naver, Cyberagent, Obic, and Mitsubishi Electric), and stocks where our original thesis had become less certain (e.g. Kurita Water and our two large bank holdings). We added to existing positions that had pulled back to attractive levels (including Samsung Electronics, Toyota Industries and Pola Orbis) and initiated new investments in extremely neglected parts of the market, such as energy and materials (more on that at a later date). Pola Orbis has steadily crept up our holdings list and is now a sizable position. This is a familyowned, high quality company with two well-positioned skin-care brands in Japan: Pola is a premium-focused product, while Orbis is “aspirational” (in other words, more affordable). The company realised early on that channel control would be important to managing the customer experience and ultimate price points, given Japan’s historical deflationary bias. Hence, almost all of the company’s products are sold directly to the customer, either door-to-door, in company owned clinics, or via the Internet. This has resulted in a highly focused product-portfolio rather than following retailer demands to broaden the number of stock-keeping units. Furthermore, the sales force of clinicians is paid on a contract commission basis, in stark contrast with competitors such as Shiseido with job-for-life type obligations. This has its complications when the product on offer is eternal youth. Taking advantage of the yen’s strength, the company acquired two foreign skincare brands in 2012, Jurlique and H20, to complement the existing focus on natural treatments. The focus is now on growing the affordable Orbis brand through South East Asia and the premium Pola brand in China via a multi-channel strategy. Management have stated a clear commitment to lifting the return on equity (RoE) via both higher profitability and shareholder 3 distributions, which we find enticing given a starting P/E multiple of 15x ex-cash (normalising for goodwill amortisation). Late last quarter and into this quarter we progressively took advantage of some of the euphoria around the broad Japan reform story (which at a corporate level is selectively real) to partially hedge the portfolio via the Nikkei Index and some stock specific shorts where we thought market expectations were running significantly ahead of reality. Following the recent correction, these have been profitably closed (though we have retained a small residual Nikkei hedge). We also shorted the Topix Real Estate Index, as investors had crowded into the space to gain exposure to the BOJ’s reflationary policies, without any regard for valuation and the reality of what is a relatively slow, though persistent, recovery. Commentary and Outlook Most of the current weakness in the Japanese economic data seems related via the export channel to the slow-down in Asia ex-Japan, the destination of some 50% of Japanese exports. For those with long memories, the parallels to 1997 are a bit too obvious, i.e. the Japanese raised the consumption tax rate on the eve of the Asian currency crisis, which went a long way to embedding Japanese deflationary expectations for the better part of the next two decades. A more considered view would pay heed to some of the differences in both the macro- and microeconomic backdrop. Apart from a banking system that is in better shape, it is compelling that just 18 months into an economic recovery in Japan, the workforce is showing signs of clear tightness (the unemployment rate is 3.7%). Arguably this is happening much earlier than in previous recoveries (see chart below). When one considers the longer-term trends, the tightness shouldn’t surprise as the available work-force has simply been shrinking (see chart over) as Japan ages. Source: IMF and INDB, compiled by SMBC NIKKO 4 Notwithstanding that the emerging wage growth will help offset the consumption tax hike, the data could be interpreted negatively on a number of counts: - Wage growth can negatively impact profit share (one reason US profit share has been rising is the lack of wage growth). - Reflects a fundamental lack of full-time labor mobility (caveat to this is that the approximate 35% of the work-force that is employed on either a part-time or contract basis, a steadily rising proportion, has never experienced the “benefits” of guaranteed lifetime employment). It’s a good thing we invest in companies, not economies. At the Japanese corporate level, the labor tightness is potentially quite positive as a catalyst for ongoing full-time workforce reorganisation. Importantly, the shame associated with making a long-serving full-time employee redundant is clearly less when that person has other worthwhile employment opportunities available. The impact on productivity and profitability is potentially significant. During the quarter we visited a range of Japanese pharmaceutical companies with Bianca Ogden, our Health Care Portfolio Manager, to discuss some of these issues. It is interesting that M3 (founded in Japan), an on-line information and marketing portal through which large pharmaceutical companies can communicate with doctors and specialists, is so successful in Japan. The paradox is that widespread adoption of this productivity tool has not actually led to any improvement in Japan’s pharmaceutical sector sales force productivity with benchmarks indicating more than twice as many sales representatives per doctor than in the West. When challenged, some of the corporates are surprisingly open about the issue and simply concede that they have too many sales reps and that outside of natural attrition, workforce reduction was difficult. From a broader perspective, these companies are lagging reform initiatives in the industrial sector where memories of the truly life-threatening nature of yen strength are still fresh. Interestingly, the largest company in the sector, Takeda Pharmaceutical, is changing, having appointed French executives to key management positions, with an announced plan to cut global costs by around $1 5 billion over three years with no exception made for the Japanese cost base. We think other companies will follow. Trends in Japanese corporate willingness to distribute profits to shareholders are also an important indicator of corporate health. The signs are encouraging, with the big-end of town taking the lead with buybacks (e.g. NTT, Hitachi, Mitsui, and Toyota). In the case of Toyota, the company consistently bought back an average just over 2% per annum of shares outstanding prior to the 2008 credit crisis; it has just announced a resumption of this program, an important indicator of growing confidence. There is always a long list of so-called “tail” risks and structural issues facing many of the large economies (China’s ageing credit binge, US long-term addiction to other people’s savings, Japan’s twin-deficits and high level of government debt, and the real risk of deflation within the European periphery). However, it is important to gauge these risks relative to starting valuations. In the case of Japan, the market has a trailing multiple of 1.2x book and a P/E discount (forward basis) relative to the world that is close to the all-time high. Consequently there remains some margin for error. However, as always, the stock specific remains far more interesting than the aggregate. On this count, not only do we remain comfortable with the stocks we own, we are also finding worthy new candidates. The issues facing the market more technically relate to the overhang of foreign buying. Although most foreigners are approaching the point, at least from a sentiment perspective, where they have given up hope of any “Third Arrow” reforms, there may still be bouts of buyer remorse. As we have stated in earlier quarterly letters, such “Third Arrow” success was never part of our base case for Japan. While we continue to watch for policy developments, our primary focus will remain actual change at the corporate level.” Our Investment Adviser has been successful in outperforming the Japanese market over the long term by drilling deeply into compelling stock and industry specific opportunities. Regarding the market itself, our view is that the combination of aggressive monetary stimulus, currency depreciation, and policy reform, on top of cheap valuations and improving corporate governance, will remain the basis for a secular uptrend. In the short term, it is no surprise that the market has taken a breather after last year’s outsized gain. After all, no market goes straight up indefinitely, and investor sentiment is always prone to bouts of temporary fickleness. Three difficult months for the market does not undo our expectation for fundamental change in Japan. If anything, we believe this temporary sell-off means that valuations are that much better. Yours sincerely, D. Dixon Boardman Disclaimer: Past performance is no guarantee of future results. The Fund commenced operation April 1, 1999. The performance record shown above reflects the actual results of the Fund. The returns given for the index are total returns in U.S. dollars which include the reinvestment of dividends. The performance calculations reflect the change in the Net Asset Value per Share for an investor who made an initial investment at the inception of the Fund and who has made no additional subscriptions to, or redemptions from, the Fund since that date and are net of all fees and expenses. The investment program of the Fund differs significantly from that of the index. The returns of the index are only included for illustrative purposes. This is not an offer to subscribe for Shares in the Fund. The offering is made only by means of the Private Placement Memorandum which describes, among other things, the risks of making an investment in the Fund and the qualifications subscribers must meet before making an investment. 6


