financial accounting
advertisement
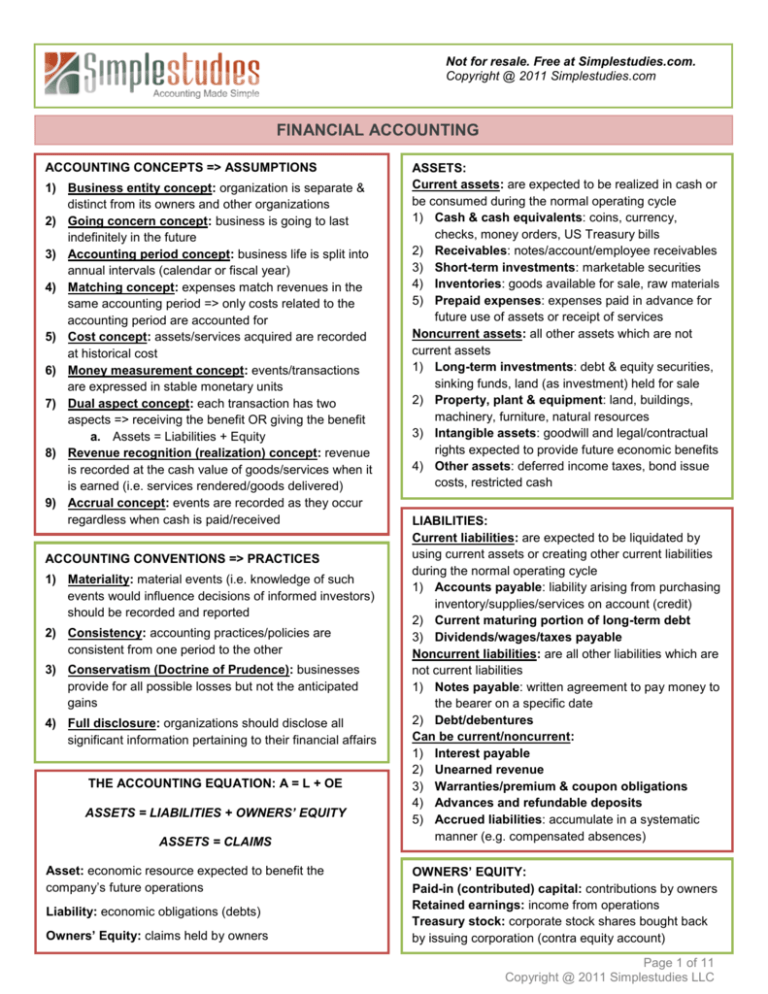
Not for resale. Free at Simplestudies.com. Copyright @ 2011 Simplestudies.com FINANCIAL ACCOUNTING ACCOUNTING CONCEPTS => ASSUMPTIONS 1) Business entity concept: organization is separate & distinct from its owners and other organizations 2) Going concern concept: business is going to last indefinitely in the future 3) Accounting period concept: business life is split into annual intervals (calendar or fiscal year) 4) Matching concept: expenses match revenues in the same accounting period => only costs related to the accounting period are accounted for 5) Cost concept: assets/services acquired are recorded at historical cost 6) Money measurement concept: events/transactions are expressed in stable monetary units 7) Dual aspect concept: each transaction has two aspects => receiving the benefit OR giving the benefit a. Assets = Liabilities + Equity 8) Revenue recognition (realization) concept: revenue is recorded at the cash value of goods/services when it is earned (i.e. services rendered/goods delivered) 9) Accrual concept: events are recorded as they occur regardless when cash is paid/received ACCOUNTING CONVENTIONS => PRACTICES 1) Materiality: material events (i.e. knowledge of such events would influence decisions of informed investors) should be recorded and reported 2) Consistency: accounting practices/policies are consistent from one period to the other 3) Conservatism (Doctrine of Prudence): businesses provide for all possible losses but not the anticipated gains 4) Full disclosure: organizations should disclose all significant information pertaining to their financial affairs THE ACCOUNTING EQUATION: A = L + OE ASSETS = LIABILITIES + OWNERS’ EQUITY ASSETS = CLAIMS Asset: economic resource expected to benefit the company’s future operations Liability: economic obligations (debts) Owners’ Equity: claims held by owners ASSETS: Current assets: are expected to be realized in cash or be consumed during the normal operating cycle 1) Cash & cash equivalents: coins, currency, checks, money orders, US Treasury bills 2) Receivables: notes/account/employee receivables 3) Short-term investments: marketable securities 4) Inventories: goods available for sale, raw materials 5) Prepaid expenses: expenses paid in advance for future use of assets or receipt of services Noncurrent assets: all other assets which are not current assets 1) Long-term investments: debt & equity securities, sinking funds, land (as investment) held for sale 2) Property, plant & equipment: land, buildings, machinery, furniture, natural resources 3) Intangible assets: goodwill and legal/contractual rights expected to provide future economic benefits 4) Other assets: deferred income taxes, bond issue costs, restricted cash LIABILITIES: Current liabilities: are expected to be liquidated by using current assets or creating other current liabilities during the normal operating cycle 1) Accounts payable: liability arising from purchasing inventory/supplies/services on account (credit) 2) Current maturing portion of long-term debt 3) Dividends/wages/taxes payable Noncurrent liabilities: are all other liabilities which are not current liabilities 1) Notes payable: written agreement to pay money to the bearer on a specific date 2) Debt/debentures Can be current/noncurrent: 1) Interest payable 2) Unearned revenue 3) Warranties/premium & coupon obligations 4) Advances and refundable deposits 5) Accrued liabilities: accumulate in a systematic manner (e.g. compensated absences) OWNERS’ EQUITY: Paid-in (contributed) capital: contributions by owners Retained earnings: income from operations Treasury stock: corporate stock shares bought back by issuing corporation (contra equity account) Page 1 of 11 Copyright @ 2011 Simplestudies LLC Not for resale. Free at Simplestudies.com. Copyright @ 2011 Simplestudies.com FINANCIAL ACCOUNTING PRESENTATION OF THE BALANCE SHEET: FINANCIAL STATEMENTS (F/S): 1) Balance Sheet: shows a financial position on a certain date (usually, month-end or year-end) a. Other name(s): Statement of Financial Position b. As of specific date c. Focus: financial position 2) Income Statement: presents revenues & expenses and resulting net income or loss over an accounting period a. Other name(s): Statement of Operations, Earnings Statement, Profit & Loss Statement b. For a period in time c. Focus: profitability 3) Statement of Changes in Equity: shows all changes in owner's equity for a period of time a. Other name(s): Owners’ Equity Statement 4) Statement of Cash Flows: summarizes information about cash outflows (payments) and inflows (receipts) a. Other name(s): Cash Flow Statement b. Focus: liquidity c. Is directly related to other 3 statements d. Sections: i. Operating activities ii. Investing activities iii. Financing activities PRESENTATION OF THE INCOME STATEMENT: Friends Company Income Statement For the Period Ended 20X0 Sales Less: Sales returns & allowances Sales discounts Net sales Cost of goods sold Gross profit Selling, general & administrative expenses Income from operations Other expense (income): Interest expense Interest income Total other expense (income) Income before income taxes Income tax expense Net income $ 500,000 30,000 20,000 450,000 150,000 300,000 120,000 180,000 400 (1,400) (1,000) 181,000 61,540 $ 119,460 Friends Company Balance Sheet Period Ended 20X0 ASSETS Current Assets: Cash Accounts receivable (net) Inventory Prepaid insurance Total Current Assets 182,060 211,000 164,000 1,200 558,260 Long-term Assets: Land Building (net of accum. depreciation) Machinery (net) Total Long-term Assets: 120,000 68,000 240,000 428,000 TOTAL ASSETS: 986,260 LIABILITIES Current Liabilities: Accounts payable Wages payable Unearned revenue Total Current Liabilities 65,000 48,000 72,000 185,000 Long-term Liabilities: Notes payable 150,000 TOTAL LIABILITIES 335,000 STOCKHOLDERS’ EQUITY Common stock Paid-in excess of par Retained earnings TOTAL STOCKHOLDERS’ EQUITY 300,000 100,000 251,260 651,260 TOTAL LIABILITIES & ST. EQUITY 986,260 CASH FLOW STATEMENT: INDIRECT METHOD 1) Convert net income from accrual to cash basis 2) Analyze changes in noncurrent assets & liabilities 3) Compare net cash change to the balance sheet Page 2 of 11 Copyright @ 2011 Simplestudies LLC Not for Resale. Free at Simplestudies.com. Copyright @ 2011 Simplestudies.com FINANCIAL ACCOUNTING PRESENTATION OF THE STATEMENT OF CASH FLOWS: Friends Company Statement of Cash Flows For the Period Ended 20X0 Cash Flows from Operating Activities: Net income Add: Depreciation Allowance for doubtful accounts Decrease in prepaid expenses Deduct: Increase in inventory Decrease in accounts payable Net Cash Flow from Operating Activities $ 119,460* 10,000 20,000 5,000 (50,000) (12,000) 92,460 Cash Flows from Investing Activities: Cash received from equipment sold Net Cash Flows from Investing Activities 24,000 24,000 Cash Flows from Financing Activities: Cash Receipts from Capital Acquisitions Cash Payments for Distributions Net Cash Flow from Financing Activities 60,000 (40,000) 20,000 Net Increase in Cash 136,460 Plus: Beginning Cash Balance 45,600 Ending Cash Balance $ 182,060** * See income statement & statement of changes in equity ** See balance sheet PRESENTATION OF THE STATEMENT OF CHANGES IN EQUITY: Friends Company Statement of Changes in Equity Period Ended 20X0 Beginning Contributed Capital Plus: Capital Acquisition Ending Contributed Capital Beginning Retained Earnings Plus: Net Income Less: Distribution Ending Retained Earnings Total Equity $ 240,000 60,000 300,000 171,800 119,460 (40,000) 251,260 $ 651,260 STATEMENT OF CASH FLOWS: SECTIONS 1) Operating activities: cash generated through revenue and cash spent for expenses a. Example: changes in noncash current assets; depreciation expense 2) Investing activities: cash received or spent on productive assets and investments in the debt or equity of other companies a. Example: purchase or sale of long-term assets (e.g., land, building, equipment) 3) Financing activities: cash transactions associated with resource providers (i.e., owners and lenders). a. Example: repayment of bank loans; dividend payment; issuance of capital stock Significant noncash activities: issuance of common stock to purchase assets; exchange of assets, issuance of debt to purchase assets USERS OF ACCOUNTING INFORMATION: External users: parties outside the reporting entity (company) who are interested in the accounting information. Example: investors, creditors, taxing authorities, customers. Internal users: parties inside the reporting entity (company) who are interested in the accounting information. Example: company’s management, employees. ACCOUNTING FIELD REGULATION: Generally Accepted Accounting Principles (GAAP) are common standards that indicate how to report economic events. Standard-setting organizations: Financial Accounting Standards Board (FASB); Securities and Exchange Commission (SEC); Public Company Accounting Oversight Board (PCAOB). ACCOUNTS: Permanent (real): are not closed each period (e.g. balance sheet accounts) Temporary (nominal): are closed at the end of each period (e.g. revenue, expenses). Closing entries produce a zero balance in each temporary account. Closing entries are recorded in the general journal. Page 3 of 11 Copyright @ 2011 Simplestudies LLC Not for Resale. Free at Simplestudies.com. Copyright @ 2011 Simplestudies.com FINANCIAL ACCOUNTING ACCOUNTING CYCLE: 1) Open ledger accounts 2) Record (journalize) transactions 3) Post to the ledger 4) Calculate unadjusted balances 5) Develop a trial balance (verify, total an balance accounts) 6) Record and post adjusting entries a. 5 categories b. Each entry effects one income statement account and one balance sheet account 7) Prepare financial statements 8) Close books (journalize and post closing entries) 9) Prepare post-closing trial balance RECORDING TRANSACTIONS: Transactions: events that affect financial position 1) Record in journals (date, account title, posting references, debits and credits) a. Journal entries are not totaled 2) Post to the ledger (date, special notations, journal reference, debits and credits) 3) Prepare a trial balance a. Journal entries are totaled Compound entry: is used when a transaction affects multiple (>2) accounts Trial balance: a list of all accounts and their balances at a specific date (point in time) ADJUSTING ENTRY CATEGORIES: 1) Depreciation: allocation of the cost of property, plant, and equipment to expenses over their useful (economic) life in a systematic and rational manner 2) Prepaid expenses: expenses paid in cash and recorded as ASSETS before they are consumed 3) Unearned revenues: cash received and recorded as LIABILITIES before revenue is earned 4) Accrued expenses: are expenses incurred but not yet paid in cash => BEFORE cash is paid 5) Accrued revenues: revenue earned but not yet received => BEFORE cash is received MERCHANDISE BUSINESS: OPERATING CYCLE 1) Purchase merchandise inventory a. Inventory: items held for resale b. Dr Purchases => net of discounts c. Cr Accounts Payable 2) Return some purchased inventory a. Purchase returns & allowances = contra asset account (credit balance) b. Dr Accounts Payable c. Cr Purchase Returns & Allowances 3) Transportation costs a. FOB Shipping Point i. When placed on carrier ii. Buyer pays shipping cost b. FOB Destination i. When received by buyer ii. Seller pays shipping cost c. Freight-in: cost incurred to deliver inventory from seller to buyer i. Product (inventory) cost d. Freight-out: cost incurred to deliver inventory from buyer to seller i. Period cost => expense 4) Sale of inventory a. Dr Cash or Accounts Receivable b. Cr Sales Revenue i. Sales Discount (contra revenue) ii. Sales Returns & Allowances 5) Receive returned merchandise a. Dr Sales Returns & Allowances b. Cr Account Receivable 6) Cost of goods sold T-ACCOUNTS: T account: an individual accounting record that shows information about increases and decreases in one balance sheet or income statement account. Debit is the LEFT side of a T account => Dr Credit is the RIGHT side of a T account => Cr Normal Account Debit Credit balance Assets Increase Decrease Debit Contra Assets Decrease Increase Credit Liabilities Decrease Increase Credit Equity Decrease Increase Credit Contra Equity Increase Decrease Debit Contributed Capital Decrease Increase Credit Revenue Decrease Increase Credit Expenses Increase Decrease Debit Distributions Increase Decrease Debit Normal balance: is the side of a T-account where increases are recorded. Page 4 of 11 Copyright @ 2011 Simplestudies LLC Not for Resale. Free at Simplestudies.com. Copyright @ 2011 Simplestudies.com FINANCIAL ACCOUNTING CASH It is the first item on the balance sheet 1) Petty cash: fund established for paying small cash expenses a. Fund disbursements are supported by petty cash voucher b. Replenish fund: cash disbursement procedures c. There is a petty cash fund custodian d. A special journal may be created e. Imprest fund: advanced money 2) Cash Short and Over: difference between actual and recorded (total) cash a. Cash shortage: Dr Cash Short and Over b. Cash excess: Cr Cash Short and Over RECEIVABLES Accounts receivable: due from customers => current asset Notes receivable: a written promise from a debtor 1) Due within one year: current asset 2) Due in one year or longer: noncurrent (long-term) Uncollectible accounts => bad debt 1) Allowance method => report at net realizable value a. Report A/R at the net realizable value b. Estimate uncollectible accounts each period c. Allowance for doubtful accounts => contra asset d. To write off an uncollectible account: i. Dr Allowance for Uncollectible Accounts ii. Cr Accounts Receivable e. To recover written-off account: i. Dr Accounts Receivable ii. Cr Allowance for Uncollectible Accounts 2) Direct write-off method => report at gross a. Write off when a particular account is determined to be uncollectible INVENTORY 1) Raw materials: goods used in production 2) Work-in-process: started but not finished production 3) Finished goods: completed manufactured items 4) Inventory systems: a) Perpetual: inventory account is adjusted perpetually b) Periodic: adjusts the inventory account only at the end of an accounting period 5) Cost of goods sold: the difference between the cost of goods available for sale and the cost of goods on hand at period end COST OF GOODS SOLD (PERIODIC SYSTEM): Beginning Inventory Plus: Purchases Plus: Transportation-in Less: Purchase Returns and Allowances Less: Purchase Discounts Cost of Goods Available for Sale Less: Ending Inventory Cost of Goods Sold LONG-TERM ASSETS: Long-term operational assets: resources with economic lives of more than a year that a business possesses and uses in generating revenue. Tangible assets: are those which one can touch and include natural resources, machinery, tools, equipment, land, etc. Intangible assets: may be represented by a piece of paper or document. Value = rights and privileges extended to their owners. Example: patent, trademark, copyrights, customer list, goodwill. Historical cost: includes the purchase price and any additional costs necessary to obtain the asset and prepare it for the intended use 1) Purchase of a building: purchase price, title search and transfer documents, real estate fees, remodeling costs, etc. 2) Purchase of equipment: purchase price, delivery costs, installation, costs for modifications to prepare the asset for intended use, etc. 3) Purchase of land: purchase price, removal of old buildings, title search and transfer documents, real estate fees, etc. COST ALLOCATION METHODS: 1) Depreciation: allocation of the cost of property, plant, and equipment to expenses over their useful life in a systematic and rational manner a. Dr Depreciation b. Cr Accumulated Depreciation c. Accumulated depreciation => total 2) Depletion: allocation of the cost of natural resources to expenses in a systematic and rational manner over the resources useful life 3) Amortization: allocation of the cost of intangible assets to expense in a systematic and rational manner over the useful life of the asset Page 5 of 11 Copyright @ 2011 Simplestudies LLC Not for Resale. Free at Simplestudies.com. Copyright @ 2011 Simplestudies.com FINANCIAL ACCOUNTING INVENTORY COSTING METHODS: 1) Specific identification: an actual physical flow inventory costing method in which items still in inventory are specifically cost to arrive at the total cost of the ending inventory: a. difficult to apply by companies that deal with massive inventory volumes with low unit costs b. management can manipulate the cost of goods sold by selecting which cost will be used in a particular sale transaction. 2) First-in, first-out (FIFO): assumes that the costs of earliest inventories acquired are the first to be recognized as the cost of goods sold. 3) Last-in, first-out (LIFO): assumes that the costs of latest inventories acquired are the first to be recognized as the cost of goods sold. 4) Weighted-average (average cost): assumes that the average cost of inventories is to be recognized as the cost of goods sold. INVENTORYCOST FLOWS: Beginning Inventory 100 units x $15 Purchase One 120 units x $18 Purchase Two 80 units x $20 = $1,500 = $2,160 = $1,600 Sale Sale = $10,800 (at SP) = TBD* (at cost) 270 units x $40 270 units x TBD* (at cost) (at cost) (at cost) FIFO => ending inventory $5,260 – 4,660 = $600 Beginning Inventory 100 units x $15 = $1,500 Purchase One 120 units x $18 = $2,160 Purchase Two 50 units x $20 = $1,000 Total (COGS) 270 units $4,660 LIFO => ending inventory $5,260 – 4,810 = $450 80 units x $20 = $1,600 Purchase Two Purchase One 120 units x $18 = $2,160 70 units x $15 = $1,050 Beginning Inventory Total (COGS) 270 units $4,810 Weighted-average => ending inventory $527 The cost of goods available for sale: 100 x $15 + 120 x $18 + 80 x $20 = $5,260 The number of goods available for sale: 100 + 120 + 80 = 300 units Weighted-average cost ÷ unit: $17.53 ($5,260 ÷ 300 units) Cost of goods sold: $4,733.1 ($17.53 x 270 units) LOWER OF COST OR MARKET: Market value: the amount that would have been paid to replace the merchandise. Lower of cost or market rule states that if the market value of ending inventory is lower than the book value of such inventory, the resultant loss must be recognized in the current period. Market Lower of Cost Item Cost Value or Market A $500 $520 $500 B $650 $590 $590 C $50 $50 $50 D $12 $13 $12 Total $1,212 $1,173 $1,152 $1,212 – 1,173 = $39 => inventory loss or ↑ COGS Perpetual: Dr COGS and Cr Inventory for $39 Periodic: loss automatically reflected in financials DEPRECIATION: 1) Straight-line depreciation: a depreciation method in which periodic depreciation is the same for each period of the asset useful life. a. (Cost – Salvage) ÷ Useful life b. Same depreciation each year 2) Double-declining method: applies a constant rate (double of the straight-line rate) to the net book value of the asset and produces a decreasing annual depreciation expense over the asset useful life. a. DDB rate = (1 ÷ Useful Life in Years) x 2 b. Only method that ignores salvage value c. Apply DDB rate to carrying (net book) value 3) Units-of-production method: determines the useful life of an asset based on the units of production. a. Depends on units of output (i.e. units used) b. Cost per unit = (Cost – Salvage) ÷ Estimated Units c. Cost per unit x Actual units used 4) Sum-of-the-years-digits method: applies a decreasing rate to the asset depreciable value and produces a decreasing depreciation expense over the useful life of the asset. a. Numerator = last year of life (backwards) b. Denominator = sum of years’ digits (N) i. N = n x (n + 1) ÷ 2, n – useful life c. (Cost – Salvage) x (Step a ÷ Step b) Page 6 of 11 Copyright @ 2011 Simplestudies LLC Not for Resale. Free at Simplestudies.com. Copyright @ 2011 Simplestudies.com FINANCIAL ACCOUNTING LIABILITIES: Payroll liabilities: obligations for employees’ compensation Contingent liability: a potential liability in the future arising out of past events (transactions) 1) Recorded when probable and reasonably estimable 2) In other cases: disclose in the notes to F/S 3) Potential events: lawsuit, standby letter of credit, expropriation threat, product defects 4) Different from commitments => legal obligations not recorded as liabilities (e.g. purchase agreements) Discounted note payable: receives face value less interest 1) Dr Cash (maturity value – interest) 2) Cr Discount on Note Payable (Interest) & Note Payable Bond payable: a written promise to pay the face amount at the maturity date 1) Interest rate: stated and market a. Stated: rate on the bond b. Market: effective rate => demanded by investors 2) Issued at premium or discount Lease liabilities: operating and capital leases 1) Operating lease: short-term a. Dr Rent Expense and Cr Cash 2) Capital lease: long-term a. Transfers ownership; bargain purchase option; lease for ≥ 75% of asset’s economic life; present value ≥ 90% asset fair value b. Dr Asset and Cr Cash & Lease Liability (PV) BONDS PAYABLE (B/P): => effective interest method Issued @premium: stated > market => A6 – A4 (see table) 1) Dr Cash and Cr Bonds Payable & Premium on B/P 2) Amortize premium: Dr Premium and Interest Expense & Cr Cash (maturity value x stated rate x period) Issued @discount: stated < market => A6 + A4 (see table) 1) Dr Cash & Discount on B/P and Cr Bond Payable 2) Amortize discount: Dr Interest Expense and Cr Discount & Cash (maturity value x stated rate x period) $10,000 bond @ 10% due in 3 years for $9,520 => effective interest rate 12% Interest Interest Unamort. Carrying Year paid expense Discount discount amount (@10%) (@12%) A1 A2 A3 A4=A3-A2 A5-A4 A6 + A4 480 9,520 1 1,000 1,142 142 338 9,662 2 1,000 1,159 159 179 9,821 3 1,000 1,179 179 0 10,000 STOCKHOLDERS’ EQUITY: 1) Contributed capital: a. Capital stock: par value common and preferred stock, common (preferred) stock subscribed, stock warrants, stock dividends to be distributed b. Additional paid-in capital: excess of par on common (preferred) stock or other sources (e.g. stock split, treasury stock) 2) Earned capital: retained earnings ISSUING STOCK: 1) Common stock at par a. Dr Cash and Cr Common Stock 2) Common stock at premium (for other assets) a. Dr Cash (Other Asset) b. Cr Common Stock (@par) c. Cr Paid-in Capital in Excess of Par TREASURY STOCK: Reasons: distributions under bonus plans; support market price; ↑ net assets; avoid take over. Purchase: Dr Treasury stock & Cr Cash 1) Shared issued: no effect 2) Shared outstanding: decrease DIVIDENDS: Stock dividend: paid in the form of additional shares 1) Reasons: conserve cash; ↓stock market price 2) Small stock dividend: <25% of stock issued a. Record @fair value (FV) b. Dr Retained Earnings (FV) c. Cr Common Stock Dividend Distributable d. Cr Paid-in Capital in Excess of Par e. Distribute: Dr Common Stock Dividend Distributable and Cr Common Stock 3) Large stock dividend: > 25% of stock issued a. Record @par value b. Dr Retained Earnings (par) c. Cr Common Stock Dividend Distributable Stock split: ↑ number of shares authorized, issued, and outstanding 1) ↓par value per share 2) No formal journal entry 3) Affect no accounts 4) Reasons ↓market price per share Page 7 of 11 Copyright @ 2011 Simplestudies LLC Not for Resale. Free at Simplestudies.com. Copyright @ 2011 Simplestudies.com MANAGERIAL & COST ACCOUNTING COSTS: 1) Manufacturing (product) costs: the costs that a company incurs in producing a product. a. Direct materials: raw materials that become an integral part of the finished goods. b. Direct labor: the cost of wages to be paid to individuals who work on specific products or in other words, the cost of wages of employees who are directly involved in converting raw materials into finished goods. c. Factory overhead: any manufacturing cost that is not direct materials or direct labor. Can have variable or fixed nature. 2) Nonmanufacturing (period) costs: costs necessary to maintain business operations but are not a necessary or integral part of the manufacturing process. Conversion Costs = Direct Labor + Factory Overhead Prime Cots = Direct Materials + Direct Labor COST DRIVERS & COST BEHAVIOR: 1) Cost: a payment of cash or its equivalent for the purpose of generating revenues. a. Financial accounting: costs and expenses are used interchangeably. b. Managerial accounting: costs differ from expenses (cost => asset) i. Cost: the amount of resources given up in order to receive some good or service and represents future economic benefit to a company 2) Cost driver: any activity that causes a change in costs over a given period of time. These activities are also called activity bases or activity drivers. 3) Cost behavior: the manner in which a cost changes in relation to changes in the related activity. a. Variable cost (VC) changes in direct proportion to changes in the level of activity (cost driver). b. Fixed costs (FC) remain constant within a relevant range of time or activity. c. Step-variable costs are costs that stay fixed over a range of activity and then change after this range is overcome. d. Mixed costs contain components of both variable and fixed cost behavior patterns. i. Fixed component: minimum cost ii. Variable component: costs that fluctuate with ∆ activity levels 4) Relevant range: the volume of activity, over which cost behavior stays valid (FC/VC assumption). METHODS FOR SEPARATING MIXED COSTS: High-method: the highest point and the lowest point are used to create the cost formula. Scatter-graph method: involves estimating the fixed and variable elements of a mixed cost visually on a graph. Method of least squares: identifies the line that best fits the data points (30 or more data observations for the activity level and the total cost) COSTS AS ASSETS/EXPENSES: Capitalized costs: expenses incurred in financing or building a fixed asset => become an expense through depreciation Inventoriable costs: expenses incurred in purchasing products for resale COST & DECISION MAKING: Opportunity cost: value of best forgone alternative Outlay cost: explicit cost => can be identified in the past, present, and future. Requires cash outlay Opportunity + outlay costs determine transfer price Differential (incremental) cost: difference in cost between any two alternatives. Decisions include: sell or process further; special order; make or buy; close a department/segment; sell obsolete inventory; scarce resources. Relevant cost: expected future cost; cost that differs between alternatives Irrelevant cost: past cost that cannot be changed or future cost that will not differ between alternatives RELEVENAT INFO & DECISION MAKING 1) Deletion/addition of new department/products a. Avoidable cost: will not continue b. Unavoidable cost: will continue 2) Pricing decisions a. Marginal cost: additional cost for one more unit produced b. Marginal revenue: additional revenue from one more unit sold c. Costs; competition; demand; regulation 3) Make-or-buy decisions: qualitative & quantitative 4) Joint product costs: differential analysis; opportunity cost analysis Page 8 of 11 Copyright @ 2011 Simplestudies LLC Not for Resale. Free at Simplestudies.com. Copyright @ 2011 Simplestudies.com MANAGERIAL & COST ACCOUNTING COST-VOLUME-PROFIT (CVP) ANALYSIS: Break-even point: revenue = expenses or profit = zero Contribution margin (CM): the difference between sales and variable costs (expenses). CM ratio => CM ÷ sales 1) Break-even in units: FC ÷ CM per unit 2) Break-even in dollars: FC ÷ CM ratio 3) Add targeted income 4) Multi-product company: use weighted-average CM Margin of safety: amount by which target or existing sales volume exceeds (or falls short of) the break-even point COST ACCUMULATION METHODS: 1) Job costing: a product costing system when costs are accumulated by specific job orders (e.g. Job Order XX2, Job Order 02357) and assigned to batches of products. a. Industries: professional services, advertising agencies, construction, shipbuilding, etc. 2) Process costing: a product costing system when costs are accumulated by departments or processes (e.g. Printing Department) and assigned to a large number of homogenous, identical products. a. Industries: textiles, food processing, automobile manufacturing, electronics, drugs, paper, etc. COST MEASUREMENT METHODS: 1) Actual costing: a product costing system when a company measures actual costs of direct materials, direct labor, and factory overhead. 2) Normal costing: a product costing system when a company measures the actual costs of direct materials and direct labor, but uses predetermined factory overhead rates to measure the factory overhead cost for a period. 3) Standard costing: a product costing system when a company measures all costs using standard quantities and costs. OVERHEAD ASSIGNMENT METHODS: 1) Volume-based (traditional) costing: a product costing system when a company allocates factory overhead costs to a single cost pool and then uses volume-based cost drivers to allocate factory overhead to individual products 2) Activity-based costing (ABC): a product costing system when a company allocates factory overhead costs to activity centers and then uses activity cost drivers to allocate factory overhead costs to individual products ABC DEVELOPMENT: 1) Identify available resources and resourceconsuming activities a. Transaction drivers count the number of times an activity occurs b. Duration drivers measure the time required to perform an activity c. Activity levels: unit, batch, product, customer, facility 2) Assign costs of available resources to activities 3) Assign costs of activities to cost objects a. Cost objects: individual products or services, job orders, projects, etc. ACCOUNTING SYSTEMS: Activity-based cost system: accumulate cost for each activity & assign cost to cost objects Just-in-time (JIT) system: produce required products at required quantity & quality when required Cost management system (CMS): analyze cost data for decision-making; measure resources used PRODUCT COSTS: 1) Absorption costing: includes all variable and fixed manufacturing costs 2) Contribution approach: only variable manufacturing costs are product costs a. Contribution margin - FC = Oper. income INVENTORY COSTS Absorption (full) costing: product cost includes all variable manufacturing cost + fixed overhead 1) GAAP: used for external reporting 2) Separate costs: product v. period costs 3) Fixed overhead rate = budgeted fixed overhead ÷ expected cost driver activity 4) Production-volume variance: applied fixed overhead – budgeted fixed overhead Variable costing: product cost includes all variable manufacturing costs 1) Fixed overhead is expensed => not GAAP 2) Cannot be used for external reporting 3) Separate costs: variable v. fixed cost Throughput costing: only direct materials cost => not GAAP (use for internal reporting) Page 9 of 11 Copyright @ 2011 Simplestudies LLC Not for Resale. Free at Simplestudies.com. Copyright @ 2011 Simplestudies.com MANAGERIAL & COST ACCOUNTING BUDGETING: Budget: plan of activities in terms of assets, liabilities, revenues, and expenses Process: set objectives; arrange strategy; prepare & implement budgets; monitor budgets & actual figures; feedback: review objectives Difficulties: all budgets rely on sales budget => past patterns, estimates, and volatile environment Master budget: projection of all budgets 1) Prepare operating budget => estimate income a. Sales budget b. Estimate cash collections c. Purchases budget d. Estimate cash disbursements for purchases e. Operating expense budget f. Estimate disbursements for operations 2) Prepare financial budget a. Cash budget b. Budgeted balance sheet BUDGET TYPES: 1) Rolling budget: a continuous budget 2) Operating budget: schedule of expected revenues, support, and expenses => budgeted income statement + accompanying schedules 3) Financial budget: part of master budget; consists of: a. Cash budget: schedule of expected cash disbursements and receipts b. Capital budget: plan for the purchase or sale of long-term assets c. Budgeted balance sheet d. Budgeted cash flow statement 4) Activity-based budget: determines necessary resources based on planned output a. From activities & drivers to underlying costs b. Separate indirect costs into activity cost pools 5) Kaizen budget: plan based on future improvements a. Cost reductions are built into the budget RESPONSIBILITY ACCOUNTING: Responsibility accounting: collect and report revenue and cost information by responsibility areas => trace costs to the activity that caused the costs and to the individual who knows the best about the cost Responsibility center: business segment, part, subunit. Centers: cost, revenue, profit, investment. MANAGEMENT CONTROL SYSTEM (MCS): 1) Identify responsibility centers a. Cost center: accumulates costs b. Profit center: revenue less expense c. Investment center: net income to invested capital 2) Analyze costs and benefits 3) Design internal controls: accounting controls and administrative controls 4) Motivate employees 5) Develop and measure performance a. Financial performance: uncontrollable and controllable costs; contribution by segment, un-allocated costs b. Non-financial performance: quality control, cycle time control, productivity control STATIC & FLEXIBLE BUDGETS: Static budget: shows expected results (of a responsibility center) only @1 activity level 1) Actual results vs. original plan 2) Disadvantage: do not adjust to ∆ activity level 3) Master budget variances: (un)favorable Flexible budget: variable budget => shows results of a responsibility center for several activity levels 1) Prepared for a range of activity 2) Flexible budget variance: flexible v. actual result a. Direct materials and direct labor variances (price & efficiency variances) b. Variable overhead variances (spending and efficiency) c. Efficiency: inputs to outputs 3) Activity level variance: flexible v. master budget CAPITAL BUDGETING: 1) Discounted cash-flow method: time value of money => cash flow at specific point in time a. Net present value: discount all expected cash flows using a required rate of return b. Internal rate-of-return: NPV = 0 2) Payback method: net receipts = investment outlays => Investment ÷ Annual net cash inflows 3) Accrual accounting rate-of-return method: considers financial reporting effects on investment (Average annual net income ÷ average investment cost) Page 10 of 11 Copyright @ 2011 Simplestudies LLC Not for Resale. Free at Simplestudies.com. Copyright @ 2011 Simplestudies.com MANAGERIAL & COST ACCOUNTING PRICING: Market-based: based on customer demand Cost-based: based on costs to manufacture goods Predatory pricing: charging very low prices (below shutdown point) for a short time to gain market share Peak-load pricing: charging higher prices during busy times Collusive pricing: pooling pricing efforts together to maintain a higher price than competition Dumping: selling goods in another country for a price lower than goods’ market value in the producing country PROCESS COSTING SYSTEM: 1) Identify units that went into production and where those units are at the end => flow of output 2) Output in unit equivalency 3) Determine the amount of production costs 4) Compute cost of ending Work-in-process (WIP) 5) Compute equivalent cost per unit (Step 4 ÷ Step 2) 6) Assign total cost to finished units & units in ending WIP Weighted-average method: includes costs in beginning inventory and current period costs First-in first-out: divide current costs by equivalent units of work done during the current period => assume first units completed are the first transferred-out HYBRID COSTING: Hybrid costing: combination of process and job order costing. Used by mass production companies with customer-order manufacturing Operation costing: used when batches of products pass through a specific sequence of repetitive activities. Direct materials are traced to each batch (like job costing) while conversion costs are allocated to all units (like process costing) Backflush costing: focuses on output and then attributes costs to stock and cost of sales. Entries are made when job is complete. Often accompanies JIT production system. JOINT PRODUCTS & BY-PRODUCTS: Joint products: two or more products produced simultaneously which cannot be individually identified until split-off has been made. Have significant market value Joint costs: common manufacturing costs => a single process that creates many different products Byproduct: has lower sales value => doesn’t affect decisions Scrap: remaining items with a minimal value ALLOCATING JOINT COSTS: 1) Physical-unit method: based on physical measure of units (e.g. gallons, pounds). Has no relationship to product revenue-producing ability 2) Relative-sales-value method: based on relative sales value at split-off point 3) Net realizable value (NRV) method: based on final sales value less projected costs to produce and sell 4) Constant gross margin % NRV method: allocates costs so gross margin is the same for all products ALLOCATING COMMON COSTS: 1) Incremental method: primary user is allocated costs (as if only one user) and secondary user is allocated the balance 2) Stand alone method: based on percentage of costs incurred by each user ALLOCATING SERVICE DEPARTMENT COSTS: 1) Direct allocation: allocates cost of each service department directly to production departments. Does not consider services performed by one service department to another 2) Step-down (sequential) allocation: based on a sequence of allocation. Starts with department that renders services to the greatest number of other service departments. 3) Reciprocal allocation: allocates service department costs to production departments. Reciprocal services are allowed between service departments. Uses simultaneous equations. Also called, simultaneous allocation; matrix method. SPOILAGE & SCRAP: Normal spoilage: spoilage under normal, efficient conditions. It is unavoidable. Product cost. Abnormal spoilage: beyond the normal spoilage rate; arises under other than normal and efficient conditions. It is recognized as a loss. Period cost. It is controllable (result of inefficiency). Process costing and spoilage: 1) Approach 1: recognize spoilage as unit output 2) Approach 2: do not include spoilage in unit output a. Spread spoilage costs over good units Page 11 of 11 Copyright @ 2011 Simplestudies LLC
