FORCED HARMONIC MOTION Ken Cheney
advertisement
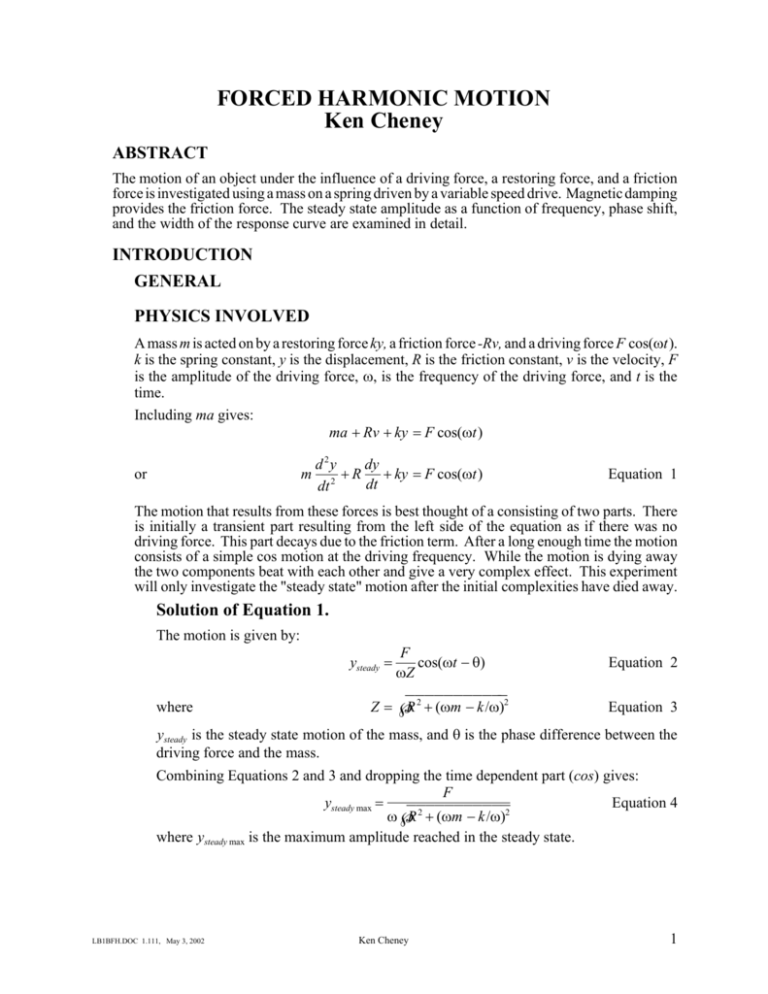
FORCED HARMONIC MOTION Ken Cheney ABSTRACT The motion of an object under the influence of a driving force, a restoring force, and a friction force is investigated using a mass on a spring driven by a variable speed drive. Magnetic damping provides the friction force. The steady state amplitude as a function of frequency, phase shift, and the width of the response curve are examined in detail. INTRODUCTION GENERAL PHYSICS INVOLVED A mass m is acted on by a restoring force ky, a friction force -Rv, and a driving force F cos(ωt). k is the spring constant, y is the displacement, R is the friction constant, v is the velocity, F is the amplitude of the driving force, ω, is the frequency of the driving force, and t is the time. Including ma gives: ma + Rv + ky = F cos(ωt) or m dy d 2y + R + ky = F cos(ωt) 2 dt dt Equation 1 The motion that results from these forces is best thought of a consisting of two parts. There is initially a transient part resulting from the left side of the equation as if there was no driving force. This part decays due to the friction term. After a long enough time the motion consists of a simple cos motion at the driving frequency. While the motion is dying away the two components beat with each other and give a very complex effect. This experiment will only investigate the "steady state" motion after the initial complexities have died away. Solution of Equation 1. The motion is given by: F cos(ωt − θ) ωZ Equation 2 Z =√ R 2 + (ωm − k/ω)2 Equation 3 ysteady = where ysteady is the steady state motion of the mass, and θ is the phase difference between the driving force and the mass. Combining Equations 2 and 3 and dropping the time dependent part (cos) gives: F ysteady max = Equation 4 ω√ R 2 + (ωm − k/ω)2 where ysteady max is the maximum amplitude reached in the steady state. LB1BFH.DOC 1.111, May 3, 2002 Ken Cheney 1 also ωm − k/ω θ = 90o + tan−1 R Equation 5 Full Width Half Maximum A plot of the maximum amplitude as a function of driving frequency gives a slightly unsymmetrical peak with the maximum at the natural frequency ω0 ω0 = √ k/m For many purposes it is important how wide this "resonance curve" is. If the resonance is narrow the mass will only respond to a narrow range of frequencies but with a large amplitude. Conversely if the resonance is broad then the mass will respond to a wide range of frequencies but only with a small amplitude. This concept of width is another aspect of the Q of a system. The Full Width Half Maximum (FWHM) is the width of the resonance curve taken at an amplitude half of the maximum of the curve. A measure of the width of the curve is given by: FWHM R = Equation 6 3 √ ω0 mω0 APPLICATIONS AMPLITUDE Applications resulting from Equation 4 are often quite spectacular. Notice what happens to y when the driving frequency matches the natural frequency and R is zero. y goes to infinity. Imagine a bridge, Tacoma Narrows say, with small damping and a wind resonating it at the natural frequency. Or, perhaps, the wing on your plane has a resonance matching the frequency of the engine? Or the water in a bay might have a natural frequency matching the tidal frequency, Bay of Fundy, forty five foot tides. Or apply this to a radio tuner. The lack of response to driving frequencies above the natural frequency is very useful for isolation. Hi-fi turntables are isolated from vibrations and cars isolate the passengers from bumps in the road this way. PHASE It appears strange that anything so esoteric as a phase shift could have spectacular results. Equation 5 says, in words, that at low frequencies the mass follows the driving force in phase, at resonance they are 90 degrees out of phase, and well above resonance they are 180 degrees out of phase. Examples where this does matter are the valves on an internal combustion (car) engine or the outer part of a hi-fi speaker. Both examples start out with the mass following the driving force in phase but at a high enough frequency they may be completely out of phase. This is very unhealthy for the engine. 2 FORCED HARMONIC MOTION Ken Cheney WIDTH Finally Equation 6 tells us about the width of a resonance. A small R produces a narrow resonance, Equation 4 says a big, narrow resonance. This big, narrow resonance is great for timing and tuning. A timer should respond lots at the proper frequency and not at all at other frequencies. The lower the resistance relative to the mass the better. Devices used have been pendulums, tuning forks, quartz crystals, and atomic or molecular vibrations. Tuning requires the same properties. A radio tuner should respond to just the desired station and ignore stations nearby in frequency no matter how strong. EXPERIMENT PASCO DRIVEN HARMONIC MOTION ANALYZER DESCRIPTION AND SETUP The specific instructions here will refer to the Pasco "Driven Harmonic Motion Analyzer" model ME-9210A. OVERVIEW A variable speed motor drives a relatively large drive wheel through a belt. The drive wheel has a drive pin offset from its center, this pin pulls one end of a string. The string oscillates one end of a spring. The other end of the spring drives a transparent mass bar which is connected to a damping rod. Photocells measure the amplitude and zero crossing of the mass bar. A LED that rotates with the drive wheel but is controlled by the zero crossing of the mass bar is displayed on the front panel and reads out the phase difference between the drive and the response of the mass bar. Connections to the game port of an Apple computer allow the program DHMA Plotter to monitor and record the amplitude, mass-bar frequency, drive-wheel frequency, and phase. AMPLITUDE AND FREQUENCY The driving force originates with a variable speed motor, the shaft of the motor extends out the back of the control box. The shaft is connected to a larger drive wheel (approximately 15 cm in diameter) by a flexible belt. This drive arrangement is common when it is desirable to filter out high frequencies that might be produced by the motor. The drive wheel has a drive pin offset from the center by a sliding amplitude bar. The bar slides along the diameter of the drive wheel and can be adjusted to give the desired driving amplitude. It is possible to adjust for zero driving amplitude, this leads to rather dull results. Finally, the drive cord which will ultimately move the driven mass is attached to the drive pin. The y motion of the drive pin is given by Rd cos(ωt) where Rd is the radius from the center of the drive wheel to the drive pin, ω is the driving frequency, and t is the time. This is just the time dependence we assumed in the theory section for forced harmonic motion. FORCED HARMONIC MOTION Ken Cheney 3 You want to adjust the amplitude to be as large as possible in order to get easily measured displacements of the driven mass. On the other hand you do not want the oscillations to destroy the apparatus. The largest oscillations occur at resonance with the minimum damping force. Set the magnetic damping to the minimum possible, set the driving frequency to resonance, and set the offset of the drive pin, Rd, as large as possible without destroying the equipment. Be careful with your initial tries, the amplitude can grow very quickly. The resonant frequency will be quite near the theoretical frequency but probably not exactly as calculated. You will have to experiment a bit to find the actual resonant frequency. DRIVING FORCE The driving force is produced by the driving amplitude, Rd, stretching the spring which holds the masses. The force, F, is given by Hook’s law F = −kRd where k is the spring constant. k can be obtained by hanging weights from the spring. ALIGNING THE MASS BAR IN THE GUIDE HOLE The mass bar must not rub on the guide hole. There are two possible adjustments. If the bar is twisted relative to the hole rotate the bar relative to the screw it is hanging from. If the guide bar is straight but rubbing on the side of the guide hole adjust the levelling screws at the bottom of the apparatus. ALIGNING THE MASS BAR WITH THE PHOTOCELLS The center of the mass bar must be aligned with the photocell in the upper mass guide. Try moving the mass bar by hand and notice that the phase set LED on the front of the upper mass guide is on when the center of the mass bar is below center and that the LED is off when the mass bar is above the center. This is controlled by the dark bar on the lower half of the mass bar on one side which blocks a photocell in the center position. Center the drive wheel at zero degrees. To do this set the mass bar oscillating and observe the LED on the PHASE scale on the front of the panel. This LED will flash on and off. Rotate the drive wheel until the phase LED is at the zero degree mark. Now adjust the length of the string and support so the smallest oscillations of the mass bar make the phase set LED flash on and off. This means that the center of the mass bar is centered on the photocell. You will probably only need to adjust the screw at the top of the support column. If things are really bad gross adjustments can be made with the plastic clip on the string above the drive wheel. 4 FORCED HARMONIC MOTION Ken Cheney MAGNETIC DAMPING Under the plastic mass bar is a damping rod made of some non magnetic material. This damping rod moves between two cylindrical magnets. These magnets can be moved closer or farther from the damping rod by large plastic screws. The magnets produce eddy currents in the damping rod which in turn produce damping forces. The forces are proportional to the velocity of the rod relative to the magnets. COMPUTER INTERFACE AND PROGRAM The software to collect and analyze the data with an Apple computer is "DHMA Plotter" by Vernier Software. CONNECTIONS Turn off the computer and DHM apparatus. Connect the two with the nine pin cable from the back of one to the back of the other. TURNING ON Make sure the DHMA Plotter disk is in the left drive of the Apple computer. Turn on the computer first. If you forget and turn on or reboot the computer with the DHM apparatus turned on the Apple goes into a self check mode and ignores the outside world. Turn off the DHM apparatus and reboot the Apple. To reboot the Apple hold down the CONTROL and the RESET keys at the same time. This has the same effect as turning the computer off then on but is much easier on the computer. USEFUL FACTS The DHMA Program defines the phase angle as the lag of the mass bar behind the drive wheel. If the mass bar leads the drive wheel then the phase angle is > 180 degrees or is negative The printer is in slot 1. The printer interface is a Grappler card. MAIN MENU The Main Menu is the core of controlling the program. You will select the procedures from it. The procedures most used are: Select Dependent Variables to Collect Mode Y Collect Data Mode K Print Data on Printer Mode T Plot Data Mode P HINTS You must select the dependent variables before starting to collect data in Mode K. When you start Mode K select drive frequency as the independent variable. FORCED HARMONIC MOTION Ken Cheney 5 Mode K displays readings continually on the screen but only reads data into memory when you tap the space bar. Don’t hold the space bar down or you may collect several readings. PROCEDURE The object is to check equations 4-6. STEADY STATE AMPLITUDE VERSES FREQUENCY The object here is to obtain enough data to determine the dependence of steady state amplitude on the driving frequency. This is to be done for minimum, maximum, and medium damping forces. i.e. three curves. A good range is from 0.1 ω0 to 10 ω0if possible. To determine each curve a number of data points are required. Each point is obtained by setting the driving frequency and waiting until the motion of the mass settles down to a constant amplitude. This procedure gives one amplitude-frequency point. You collect the data just by touching the space bar on the computer. To get the best data with a minimum number of data points some planing and plotting is required. The interesting data is centered around the resonant frequency. You need enough points near the resonant frequency to be sure of the behavior in this region. The amplitude changes very rapidly in this region so it is easy to miss some vital points. By far the best way to be sure you have the necessary points is to make a rough plot of your results as you take the data. The eye is very good as spotting oddities in curves but can’t do much for you with a data table. On the other hand you want to investigate frequencies far enough away from resonance to be sure what the curve looks like at the extremes. If you don’t take larger steps in frequency in this region you may require weeks to get your data. Again, to get the best data: PLOT AS YOU GO! PHASE VERSES DRIVING FREQUENCY Be sure to record the phase at steady state for each combination of damping and driving frequency. This is done automatically if you selected both phase and amplitude as dependent variables. ANALYSIS EXPECTED Use FITSALL to compare the resonance and phase curves with theory. Discuss how well they match, or fail to match theory. 6 FORCED HARMONIC MOTION Ken Cheney RESONANCE CURVE For FITSALL: ysteady max = F Equation 4 ω√ R 2 + (ωm − k/ω)2 becomes 3000 DEF LONG FNA(X)=A(1)+A(2)/(X*SQR(A(3)**2+ (X*A(4)-k/X)**2)) This all goes on one line. Don’t type in k but instead put in your value for the spring constant. Symbol Meaning Suggested Guess X Driving Frequency ω in radians --------------- A(1) Offset Zero A(2) Driving Force kRd, Rd is the offset of the drive pin A(3) Damping Constant, R From FWHM A(4) Mass Mass bar + Damping bar + 1/3 spring It would be good to solve for k also but notice that any number of combinations of m and k give the same values for (ωm − k/ω). As a result it is only possible to solve for k or m, not both at once. PHASE VERSES DRIVING FREQUENCY For FITSALL: ωm − k/ω π θ = + tan−1 2 R Equation 5 becomes, in radians: 3000 DEF LONG FNA(X)=PIX(0.5)+ATN((X*A(1)-k/X)/A(2)) PIX(0.5) means π *0.5 ATN(X) means tan−1(x) Just as in the amplitude case we can’s solve simultaneously for m and k. Symbol Meaning Suggested Guess X Driving Frequency ω in radians --------------- A(1) Mass Mass bar + Damping bar + 1/3 spring A(2) Damping Constant, R From FWHM FORCED HARMONIC MOTION Ken Cheney 7 FWHM Measure the FWHM for each size of damping from the curves obtained above. Compare with theory. OVERALL It is very helpful to see all three resonance curves at once, it is much easier to appreciate the effect of damping when everything is plotted to the same scale on the same page. It is easy to write a small BASIC program which will plot your experimental points and the best fit curves obtained from FITSALL. See the sample below, DATAPLOT.PUB.PHYSCI. WRITE UP EXPECTED Formal write-up. No introduction. Enough sketches to explain any measurements. Good equipment list. GRADING CONSIDERATIONS The important part is a thoughtful discussion of how the results compare with theory and what interesting features there are in your results. Don’t forget to discuss your computer results including the Standard Errors. 8 FORCED HARMONIC MOTION Ken Cheney
