21 The Amazing Maize
advertisement
21
,.,.-.-----
The Amazing Maize
.The Amazing Maize
lnvestigating
Dihybrid Crosses
nrprrr
••· -Tnh~"
l'\Jfpn,-tpl rt
~??_1 - ~~4'
",I<>C <1" Ahhnt i\Jfnnlr u/hn rlicrn1l
-- -0-------.------\.- --- - OJ
•• _--- --._ .•• -.----•• __ •••• -----.
••r••rI
th
•• fimrl::arnpnbJ
-------
--------,p---
nr1nrinlpQ
r------r ..- n-f
-
genetic traits. His work was published in 1866 but was not noticed and recognized for its brilliance until
the turn of the 20th century. His work focused on plant breeding projects and, in particular, the garden
pea, Mendel worked with true-breeding strains, with each strain differing from each other 111 very
distinct characteristics. This made it easy to identify the results from his experiments. Peas were a very
appropriate choice of organisms for genetic study because Mendel could obtain large numbers of results
in a reiatively short period of time.
After studying and analyzing monohybrid crosses, Gregor Mendel began to study the results of crossing
two traits at a time. It is a fortunate coincidence that Mendel selected two traits that happened to be on
different chromosomes. He worked with pure-bred peas that were round and yellow and crossed them
with pure-bred peas that were wrinkled and green. In the parental cross of round and yellow with that of
wrinkled and green, all of the offspring from the parental cross were yellow and round seeds. This
meant that yellow and round alleles were dominant. Mendel then allowed these FI offspring which
were heterozygous for both traits to self-pollinate and produce a F2 generation. The F2 generation
produced seeds that were yellow and round and seeds that were green and wrinkled.
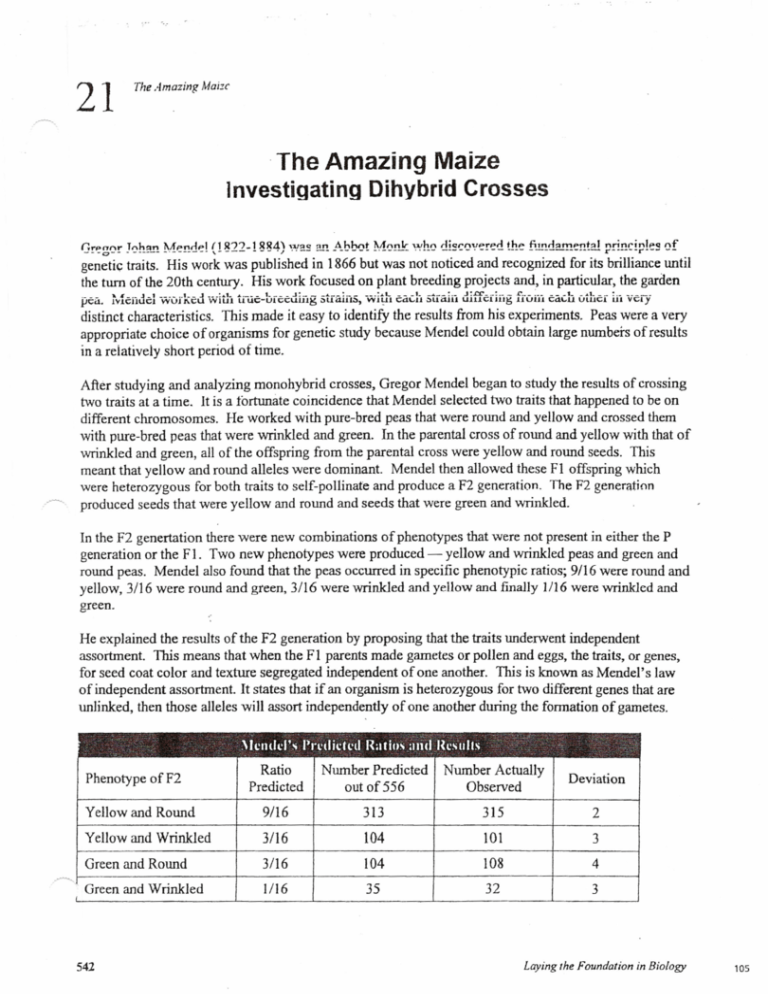
In the F2 genertation there were new combinations of phenotypes that were not present in either the P
generation or the Fl. Two new phenotypes were produced - yellow and wrinkled peas and green and
round peas. Mendel also found that the peas occurred in specific phenotypic ratios; 9116 were round and
yellow, 3/16 were round and green, 3116 were wrinkled and yellow and finally 1116 were wrinkled and
green.
He explained the results of the F2 generation by proposing that the traits underwent independent
assortment. This means that when the F 1 parents made gametes or pollen and eggs, the traits, or genes,
for seed coat color and texture segregated independent of one another. This is known as Mendel's law
of independent assortment. It states that if an organism is heterozygous for two different genes that are
unlinked, then those alleles will assort independently of one another during the formation of gametes.
-
:\Icndcl's Prcdieteil R.llins and I{csulls
Ratio
Predicted
Number Predicted
out of556
Number Actually
Observed
Deviation
Yellow and Round
9116
313
315
2
Yellow and Wrinkled
3116
104
101
3
Green and Round
3116
104
108
4
Green and Wrinkled
1116
35
32
3
Phenotype of F2
-
.-
~
542
-
Laying the Foundation in Biology
105
The Amazing Maize
8
p
Yellow round
8
X
!
21
Green wrinkled
yr
All yellow-round
(heterozygous for
both traits)
8x 8
Fl
Yellow round
YR.
YR
Yr
F2
yR
yr
Yr
Yellow round
yR
yr
8 8 88
8 8 8 <9
88 8 8
8 <9 8 8
Y. Y. R. r assort
independent of one
another in the
. formation of gametes
F2 Generation
9/16 Yellow round
3/16 Green round
3/16 Yel/ow wrinkled
1/16 Green wrinkled
After the rediscovery of Mendel's work in 1900, many biologists began studying genetics. The two
organisms of choice were the Drosophila fruit fly and maize or com. Barbara McClintock and her
colleagues studied com extensively at Cornell University. Maize is an excellent choice for genetic study
for the very same reasons that Mendel chose peas. There are a number of very distinct traits for the seed
or com kernel and a large number of offspring are produced in each generation. The large number of
offspring in com makes it even more advantageous than peas. An ear of com can average 500-600
seeds whereas pea pods contain 4-6 seeds. It is through McClintock's studies that transposons or
"jumping genes" were discovered. Barbara McClintock received a belated Nobel Prize in 1983 for her
discovery.
In this activity you will use com to examine two traits. You will study starchy kernels versus sweet
kernels and purple kernels versus yellow kernels. The starchy gene produces kernels of corn that have a
high content of starch. When these starchy kernels dry out, they remain full and plump whereas the
kernels that contain high sugar content wrinkle upon drying. The second trait to be examined is color.
The purple trait found in corn is due to the deposition of anthocyanin (plant pigment) in the outer layer
of the endosperm or seed. If the pigment is not made, then the seed will typically have a yellow color.
PURPOSE
The purpose of this activity illustrates Mendel's Law of Independent Assortment through a dihybrid
.
.
cross usmg marze.
Laying the Foundation in Biology
106
21
The Amazing Maize
MATERIALS
2 parental ears of com
I F2 ear of com
1 Fl ear of com
2 colored push pins
PROCEDURE
1. DO NOT REMOVE ANY SEED FROM ANY EAR OF CORN. Obtain two ears of com that
represent the parental generation. One ear should be purple and smooth; the other should be yellow
and wrinkled. Formulate a hypothesis predicting the phenotypic ratios that would result from a cross
between two com plants that are both heterozygous for purple and starch. Record your hypothesis
on student answer page.
2. Obtain an Fl ear of corn. By looking at the Fl ear of com, determine what phenotypes are dominant
and what phenotypes are recessive.
3. Write out the genotype using R's for purple and yellow and S's for starchy and sugary for the P
generation and the Fl generation on the student answer page.
4. Predict the phenotypic ratio in the F2 generation for a cross that is heterozygous for both color of
seed coat and texture (RISs x RrSs). Record your predicted genotypes in F2 Punnett square space on
.-----,the student answer page.
5. Obtain an F2 ear of com. Look at the different phenotypes for the kernels of corn and make sure that
you can distinguish among kernels that are: purple and smooth, purple and wrinkled, yellow and
smooth, as well as yellow and wrinkled.
6. Put a colored marker pin in the end of one row of com kernels. This will be used to mark your
starting position. Count all the kernels that are both purple and smooth in that row. Record that
number in the space provided in Data Table 1.
7. Repeat step six, this time counting all the kernels that are purple and wrinkled. Be sure to record the
number in the space provided in Data Table 1. Repeat step 6 for the last two phenotypes.
8. Using another colored pin to mark your current position, move one row over. Repeat steps 6-8.
After each row is counted, move the row marker to the next row and continue until you return to
your starting place.
9. Total the number of seeds found in each phenotype.
..~,
10. Calculate the total number expected for each phenotype by multiplying the total number of kernels
counted on the cob by the expected fraction of each of the phenotype. For example, if you counted
500 kernels and expect to find 9/16 of them to be purple and smooth, then the expected value for that
phenotype would be 280. (500 X 9/16 =281)
11. Calculate the Chi-square value for your results to determine whether or not the results support your
hypothesis.
544
Laying the Foundation in Biology
107
The Amazing Maize
21
Name
_
Period
_
The Amazing Maize
Investigating Dihybrid Crosses
HYPOTHESIS
DATA AND OBSERVATIONS
Expected:
•
Write out a sununary of the Pl, Fl ~E2.krosses.
r,
p
Fl
x-~
F2
Laying the Foundation in Biology
108
21
The Amazing Maize
nutn Tahle I
~
Phenotype
Purple Smooth
Purple Wrinkled
Yellow Smooth
Yellow Wrinkled
Total Number
Observed
Total Number
Expected
Deviation
CONCLUSION
QUESTIONS
L Describe the PI generation's
phenotype and write out their genotypes.
2. Which phenotypes are dominant? How do you know?
546
Laying the Foundation in Biology
109
The Amazing Maize
21
3. How do the observed numbers differ from the predicted numbers?
4. Based on your data determine a Chi-square value for the phenotypes produced. Remember the
equation for Chi-Square is
X2 =
I (observed
- expected)2
expected
,
5. Are the deviations shown in your data due to chance as determined by the Chi-square value?
4~t,"~~t~3~~~~~:::ir.'.~;tt~~~~:~~:·
'f-i!~fnjfi~~~!:~;~'ifi~WlrY~:nI~!Wjj1~~S~~:.
}~~~~:~;~~~~;~
..~}~0'::
-,';~1
p is the probability that the results could be due to chance alone. The numbers in parentheses below
each value of p restate p in terms of chance: 9 in 10 likelihood that the results could be due chance
alone.
p= 0.9
(9 in 10)
p=O.S
p=0.2
freedom
(1 in 2)
(1 in 5)
P = 0.05
(1 in 20)
p = 0.01
(1 in 100)
p= 0.001
'(1 in 1000)
1
0.158
0.455
1.642
3.841
6.635
10.827
2
0.214
1.386
3.219
5.991
9.210
13.815
3
0.584
2.366
4.642
7.815
11.345
J6.268
4
1.064
3.367
5.989
9.488
13.277
18.465
5
1.610
4.351
7.289
11.070
15.086
20.517
6
2.204
5.348
8.558
12.592
16.812
22.457
7
2.333
6.346
9.903
14.067
18.475
24.322
8
3.490
7.344
11.303
15.507
20.090
26.125
9
4.168
8.343
12.242
16.919
21.660
27.877
10
4.865
9.342
13.442
18.307
23.209
29.588
Degrees
Laying the Foundation in Biology
110
