HIgHEST-PAID WOMEN ExECUTIVES - UC Davis Graduate School
advertisement
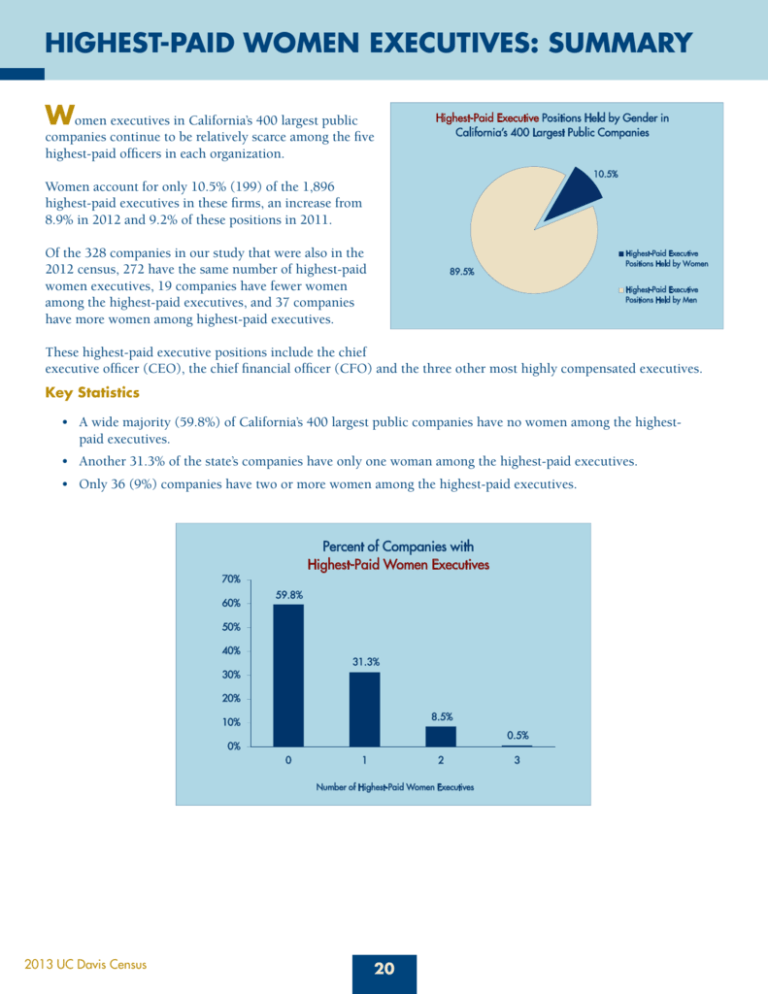
HIGHEST-PAID WOMEN EXECUTIVES: SUMMARY Women executives in California’s 400 largest public companies continue to be relatively scarce among the five highest-paid officers in each organization. Highest-Paid Executive Positions Held by Gender in California’s 400 Largest Public Companies 10.5% Women account for only 10.5% (199) of the 1,896 highest-paid executives in these firms, an increase from 8.9% in 2012 and 9.2% of these positions in 2011. Of the 328 companies in our study that were also in the 2012 census, 272 have the same number of highest-paid women executives, 19 companies have fewer women among the highest-paid executives, and 37 companies have more women among highest-paid executives. Highest-Paid Executive Positions Held by Women 89.5% Highest-Paid Executive Positions Held by Men These highest-paid executive positions include the chief executive officer (CEO), the chief financial officer (CFO) and the three other most highly compensated executives. Key Statistics • A wide majority (59.8%) of California’s 400 largest public companies have no women among the highest paid executives. • Another 31.3% of the state’s companies have only one woman among the highest-paid executives. • Only 36 (9%) companies have two or more women among the highest-paid executives. Percent of Companies with Highest-Paid Women Executives 70% 60% 59.8% 50% 40% 31.3% 30% 20% 8.5% 10% 0.5% 0% 0 1 2 Number of Highest-Paid Women Executives 2013 UC Davis Census 20 3 HIGHEST-PAID WOMEN EXECUTIVES BY COMPANY Only 36 of California’s 400 largest public companies have two or more women among highest-paid executives. Companies with Two or More Highest-Paid Women Executives # women top executives in 2013 in red (# women top executives in 2012 in blue) SciClone Pharmaceuticals Inc. 3 (0) Hyperion Therapeutics Inc. 2 (-)9 Quantum Corp. 2 (2) Williams-Sonoma Inc. 3 (3) Jamba Inc. 2 (3) QuinStreet Inc. 2 (2) American States Water Co. 2 (2) Juniper Networks Inc. 2 (2) Safeway Inc. 2 (2) AMN Healthcare Services Inc. 2 (2) Kratos Defense & Security Solutions Inc. 2 (1) Santarus Inc. 2 (2) Annie’s Inc. 2 (2) LTC Properties Inc. 2 (2) Sempra Energy 2 (2) bebe stores Inc. 2 (2) Medivation Inc. 2 (2) ServiceSource International Inc. 2 (0) DreamWorks Animation Inc. 2 (2) Monolithic Power Systems Inc. 2 (1) True Religion Apparel Inc. 2 (1) Ensign Group Inc. 2 (2) NVIDIA Corp. 2 (2) Varian Medical Systems Inc. 2 (1) Exelixis Inc. 2 (2) Oplink Communications Inc. 2 (2) VMware Inc. 2 (1) Wells Fargo & Co. 2 (1) Extreme Networks Inc. 2 (1) Pacific Sunwear of California Inc. 2 (2) Genomic Health Inc. 2 (1) Pharmacyclics Inc. 2 (1) Wet Seal Inc. 2 (3) Hewlett-Packard Co. 2 (2) Plantronics Inc. 2 (2) Yahoo! Inc. 2 (0) 9 Company's first proxy report was filed in 2013. A wide majority (239) of the state’s 400 largest public companies have no women among the highest-paid executives. These companies report, on average, 4.7 male highest-paid executives each (versus 3.6 in other companies). • Of the 328 companies that were also in our 2012 study, 195 (59.5%) have no women among the highest-paid executives in 2013. Of these 195, 180 (92.3%) also had no women among the highest-paid executives in 2012. One company (0.5%) had two women among the highest-paid executives in 2012 but lost two women in the last year, and the remaining 14 companies (7.2%) had one woman among the highest-paid executives in 2012 but lost a woman in the last year. • Of the 72 companies that were not in the 2012 census, 44 (61.1%) have no women among the highest-paid executives in 2013. Companies with No Women Among the Highest-Paid Executives Abaxis Inc. Callaway Golf Co. Excel Trust Inc. Ligand Pharmaceuticals Inc. ProLogis Inc. Acacia Research Corp. CapitalSource Inc. Fair Isaac Corp. Limoneira Co. Proofpoint Inc. Sunstone Hotel Investors Inc. Supertex Inc. ACADIA Pharmaceuticals Inc. Cavium Inc. Fairchild Semiconductor International Inc. Linear Technology Corp. Puma Biotechnology Inc. SYNNEX Corp. ACTIVE Network Inc. CBRE Group Inc. Finisar Corp. LinkedIn Corp. QUALCOMM Inc. Synopsys Inc. Activision Blizzard Inc. Cepheid Inc. First American Financial Corp. Lions Gate Entertainment Corp. Qualys Inc. TearLab Corp. Actuate Corp. Cerus Corp. FormFactor Inc. Macerich Co. Questcor Pharmaceuticals Inc. Terreno Realty Corp. Adobe Systems Inc. Ceva Inc. Google Inc. MannKind Corp. Quidel Corp. Tesla Motors Inc. Advent Software Inc. Cisco Systems Inc. Green Dot Corp. Marin Software Inc. Quiksilver Inc. Tetra Tech Inc. Affymetrix Inc. City National Corp. Guess? Inc. Marketo Inc. Rambus Inc. Theravance Inc. Agilent Technologies Inc. Clean Energy Fuels Corp. HCP Inc. Masimo Corp. ReachLocal Inc. Threshold Pharmaceuticals Air Lease Corp. Cohu Inc. Herbalife Ltd. Mattel Inc. RealD Inc. TiVo Inc. Alexandria Real Estate Equities Inc. Colony Financial Inc. Hudson Pacific Properties Inc. Maxim Integrated Products Inc. Realty Income Corp. TRI Pointe Homes Inc. Allergan Inc. CoreLogic Inc. iGATE Corp. McGrath RentCorp Redwood Trust Inc. Trimble Navigation Ltd. Altera Corp. Cornerstone OnDemand Inc. Illumina Inc. Mercury General Corp. Regulus Therapeutics Inc. Trius Therapeutics Inc. Ambarella Inc. Cubic Corp. Immersion Corp. Micrel Inc. Rentech Inc. Trulia Inc. American Assets Trust Inc. CVB Financial Corp. Imperva Inc. Microsemi Corp. Resmed Inc. TTM Technologies Inc. American Vanguard Corp. Cyan Inc. Infoblox Inc. Model N Inc. Responsys Inc. Tutor Perini Corp. Amgen Inc. Cypress Semiconductor Corp. Ingram Micro Inc. Monster Beverage Corp. Rigel Pharmaceuticals Inc. Ultratech Inc. Anworth Mortgage Asset Corp. DepoMed Inc. Inphi Corp. Natus Medical Inc. Riverbed Technology Inc. United Online Inc. Apple Inc. DexCom Inc. Integrated Device Technology Inc. Nektar Therapeutics Robert Half International Inc. Universal Electronics Inc. Applied Materials Inc. Digital Realty Trust Inc. Integrated Silicon Solution Inc. NeoPhotonics Corp. Rovi Corp. URS Corp. Applied Micro Circuits Corp. DIRECTV Intermolecular Inc. NetApp Inc. RPX Corp. ValueClick Inc. Arena Pharmaceuticals Inc. Dolby Laboratories Inc. International Rectifier Corp. Netflix Inc. Ryland Group Inc. VCA Antech Inc. Aruba Networks Inc. Dole Food Co. Inc. Intuitive Surgical Inc. NetSuite Inc. Salesforce.com Inc. Verifone Systems Inc. Astex Pharmaceuticals Inc. Douglas Emmett Inc. InvenSense Inc. Neurocrine Biosciences Inc. Sangamo BioSciences Inc. Vocera Communications Inc. Atmel Corp. DTS Inc. IPC The Hospitalist Co. Inc. Newport Corp. Sanmina-SCI Corp. Volcano Corp. Audience Inc. E2open Inc. Ixia NuVasive Inc. Schwab Corp. Volterra Semiconductor Corp. Avery Dennison Corp. Edison International IXYS Corp. On Assignment Inc. Semtech Corp. WD-40 Co. Big 5 Sporting Goods Corp. Edwards Lifesciences Corp. Jacobs Engineering Group Inc. OpenTable Inc. Sequenom Inc. Wesco Aircraft Holdings Inc. Biomarin Pharmaceutical Inc. eGain Corp. JAKKS Pacific Inc. OSI Systems Inc. ServiceNow Inc. West Marine Inc. BioMed Realty Trust Inc. eHealth Inc. JDS Uniphase Corp. Palo Alto Networks Inc. Shutterfly Inc. Western Asset Mortgage Capital Corp. BJ’s Restaurants Inc. Electronic Arts Inc. Jive Software Inc. Pandora Media Inc. Silicon Image Inc. Western Digital Corp. BreitBurn Energy Partners LP Electronics for Imaging Inc. Kaiser Aluminum Corp. PDF Solutions Inc. SJW Corp. William Lyon Homes Broadcom Corp. Encore Capital Group Inc. KB Home Peregrine Semiconductor Corp. Skechers U.S.A. Inc. Workday Inc. Brocade Communications Systems Inc. Endologix Inc. Keynote Systems Inc. PG&E Corp. SolarCity Corp. Xilinx Inc. Cadence Design Systems Inc. Enphase Energy Inc. Kilroy Realty Corp. PICO Holdings Inc. Solazyme Inc. XOMA Corp. CalAmp Corp. Entravision Communications KLA-Tencor Corp. PMC-Sierra Inc. Splunk Inc. Xoom Corp. Calavo Growers Inc. Entropic Communications Inc. Leap Wireless International Inc. Power Integrations Inc. Stamps.com Inc. Yelp Inc. California Water Service Group Essex Property Trust Inc. LeapFrog Enterprises Inc. PriceSmart Inc. Sunesis Pharmaceuticals Inc. Zynga Inc. Calix Inc. Exar Corp. Life Technologies Corp. Procera Networks Inc. SunPower Corp. 21 2013 UC Davis Census WOMEN IN THE MOST IMPORTANT CORPORATE ROLES Of the 400 largest public companies in California, 13 are led by women chief executive officers. Although this is the same number as in 2012 and 2011, four women are new to this list. Nine of these women were on last year’s list. Four women who were on last year’s list do not appear on this year’s list. • Of the four women appearing on the chief executive officer (CEO) list for the first time, two are CEOs of newly created companies that filed their first proxy report in 2013 (Lisa Im of Performant Financial Corp. and Selina Lo of Ruckus Wireless Inc.), one replaced a male CEO at a company that was in our study last year (Karen Colonias of Simpson Manufacturing Co. Inc.), and the other replaced a female CEO and male Interim CEO at a company that also appeared in our study last year (Marissa Mayer of Yahoo! Inc.). • Four women who were on last year’s CEO list do not appear on this year’s list. Three of the four companies are in the study this year and have a male CEO. The fourth company has been acquired by a private, out-ofstate firm. • The number of women serving as the chief financial officer in California’s 400 largest public companies continues to grow, reaching 52 this year, up from 47 last year and 45 in 2011. Chief Operating Officer / President Chief Executive Officer Susan Salka Constance Moore Julia Stewart Kimberly Popovits Margaret Whitman Linda Lang 10 Wendy Simpson Lisa C. Im Selina Y. Lo Debra Reed Karen Colonias Laura Alber Marissa A. Mayer Jane A. Chmielinski Susan R. Salka Emilia Fabricant Talbott Roche Constance B. Moore Ann Daly Sheryl K. Sandberg Jennifer M. Johnson Kimberly J. Popovits Margaret C. Whitman B. Lynne Parshall Wendy L. Simpson Terry P. Bayer Safra A. Catz Mahkam (Maky) Zanganeh Bronwyn Syiek Barbara Rentler Selina Y. Lo Karen Colonias Lynne Koplin Laura J. Alber AMN Healthcare Services Inc. BRE Properties Inc. DineEquity Inc. Genomic Health Inc. Hewlett-Packard Co. Jack in the Box Inc. LTC Properties Inc. Performant Financial Corp. Ruckus Wireless Inc. Sempra Energy Simpson Manufacturing Co. Inc. Williams-Sonoma Inc. Yahoo! Inc. 10 Announced retirement effective January 1, 2014. Will be replaced by Leonard Comma as Chairman and CEO. AECOM Technology Corp. AMN Healthcare Services Inc. bebe stores Inc. Blackhawk Network Holdings Inc. BRE Properties Inc. DreamWorks Animation Inc. Facebook Inc. Franklin Resources Inc. Genomic Health Inc. Hewlett-Packard Co. Isis Pharmaceuticals Inc. LTC Properties Inc. Molina Healthcare Inc. Oracle Corp. Pharmacyclics Inc. QuinStreet Inc. Ross Stores Inc. Ruckus Wireless Inc. Simpson Manufacturing Co. Inc. True Religion Apparel Inc. Williams-Sonoma Inc. Chief Financial Officer Eva G. Tang American States Water Co. Pamela Shelley-Kessler LTC Properties Inc. Kelly J. Kennedy Annie’s Inc. Meera Rao Monolithic Power Systems Inc. Laura J. Neumann Arden Group Inc. Rachel Glaser Move Inc. Christine A. Tsingos Bio-Rad Laboratories Inc. Christine M. Gorjanc NETGEAR Inc. Susan M. Kanaya ChemoCentryx Inc. Karen T. Burns NVIDIA Corp. Patricia Yarrington Chevron Corp. Cynthia L. Walker Occidental Petroleum Corp. Helene Simonet Coherent Inc. Shirley Yin Oplink Communications Inc. Stacy Loretz-Congdon Core Mark Holding Co. Inc. Safra A. Catz Oracle Corp. Sharon A. Barbari Cytokinetics Inc. Anne D. McCallion PennyMac Mortgage Investment Trust Suzanne D. Snapper Ensign Group Inc. Pam Strayer Plantronics Inc. Nancy Bush Fortinet Inc. Mardi C. Dier Portola Pharmaceuticals Inc. Sabrina Simmons Gap Inc. Jean Hu QLogic Corp. Kathleen E. Redd GenCorp Inc. Linda M. Breard Quantum Corp. Robin L. Washington Gilead Sciences Inc. Laurel J. Krzeminski Granite Construction Inc. Kim R. Tsuchimoto11 Karla R. Lewis Reliance Steel & Aluminum Co. Raptor Pharmaceutical Corp. Karen Blasing Guidewire Software Inc. Karen Boone Restoration Hardware Holdings Inc. Carolyn V. Aver Harmonic Inc. Judy Bruner SanDisk Corp. Jessica Baron Hercules Technology Growth Capital Inc. Debra P. Crawford Santarus Inc. Catherine A. Lesjak Hewlett-Packard Co. Deborah Andrews STAAR Surgical Co. Ita M. Brennan Infinera Corp. Kathleen A. Bayless Synaptics Inc. B. Lynne Parshall11 Kathleen M. Griggs Isis Pharmaceuticals Inc. Susan L. Main Teledyne Technologies Inc. j2 Global Inc. Diana M. Laing Thomas Properties Group Karen L. Luey Jamba Inc. Sydney Carey TIBCO Software Inc. Robyn M. Denholm Juniper Networks Inc. Elisha W. Finney Varian Medical Systems Inc. Deanna Lund Kratos Defense & Security Solutions Inc. Kathy Willard Live Nation Entertainment Inc. Jill M. Broadfoot11 Julie P. Whalen Williams-Sonoma Inc. 11 2013 UC Davis Census Left after fiscal year-end and is no longer serving in the role. 22 Vical Inc. HIGHEST-PAID WOMEN EXECUTIVES BY INDUSTRY Well over one-third (40.3%) of California’s 400 largest public companies have at least one highest-paid woman executive. When the companies are categorized by industry, there is wide variation in the percentage of companies with highest-paid women executives. Almost 30 percentage points separate the industry whose firms are most likely to have at least one highest-paid woman executive (50%) from the industry whose firms are least likely to have at least one highest-paid woman executive (20.8%). How Industries Compare: Percent of Companies with One or More Highest-Paid Women Executives Pharmaceuticals 50% Health Care 50% 46% Consumer Goods Energy, Materials & Industrials 43% Technology Hardware 43% 41% Financial Services 38% Utilities & Telecommunications 36% Technology Software 33% Real Estate 21% Semiconductors 0% 10% 20% 30% 40% 50% 60% Among the 10 industry categories we identify, the 54 pharmaceutical companies were the most likely (50%) to have at least one highest-paid woman executive for the second year in a row. In a tie with the pharmaceutical industry this year, companies in the health care industry are also most likely (50%) to have at least one highest-paid woman executive. In the consumer goods sector, 46.3% of firms have at least one highest-paid woman executive. The 48 companies in the semiconductors industry were the least likely (20.8%) to have at least one highest-paid woman executive in 2013. The semiconductors industry is a statistical outlier, having so few companies with women leaders. Stated another way, almost four-fifths of this industry (79.2%) comprises companies whose highest-paid executives are all men. 23 2013 UC Davis Census HIGHEST-PAID WOMEN EXECUTIVES BY INDUSTRY The pharmaceuticals industry has the greatest percentage of highest-paid women executives. For the 54 companies in this sector, 13.8% of highest-paid executives are women. The 54 firms in the consumer goods industry follow close behind with the second-highest percentage (13.7%). Firms in the semiconductors and real estate industries have the lowest percentages of highest-paid women executives (5.3% and 7.7%, respectively). Firms in these two sectors are also the least likely to have a women in their highestpaid management teams (20.8% and 33.3%). Percent of Highest-Paid Women Executives by Industry INDUSTRY Pharmaceuticals Consumer Goods Utilities & Telecommunications Health Care Technology Hardware Financial Services Energy, Materials & Industrials Technology Software Real Estate Semiconductors % HIGHEST-PAID WOMEN EXECUTIVES INDUSTRY REVENUES (B) 13.8% 13.7% 12.8% 12.3% 11.8% 10.0% 9.3% 8.9% 7.7% 5.3% $51.31 $220.52 $41.09 $162.21 $456.99 $115.63 $319.14 $181.17 $22.22 $112.59 # COMPANIES 54 54 8 32 51 17 37 69 30 48 Key Statistics • The pharmaceuticals and health care industries have the largest proportion of companies (50%) with at least one woman among their highest-paid executive officers. The pharmaceuticals industry has the highest percentage of women highest-paid executives (13.8%). • Firms in four industries (energy, materials & industrials; technology software; real estate; and semiconductors) all average fewer than 10% of highest-paid executive positions held by women. • The semiconductors sector is a statistical outlier with only one-fifth of its companies having any women highest-paid executives. In semiconductor companies, only 5.3% of highest-paid executive positions, on average, are held by women. 2013 UC Davis Census 24 HIGHEST-PAID WOMEN EXECUTIVES BY COMPANY SIZE While large companies tend to have both larger boards and a greater representation of women on their boards, the relationship between firm size and the representation of women in executive suites among California’s 400 largest public companies is less clear. We segment companies into 10 size groups according to their annual revenue in the most recent fiscal year. Companies of all sizes generally report five highest-paid executives. However, whether measured by market capitalization or total revenue, the largest firms in our study have almost the same percentage of highest-paid women executives as do the smallest firms in our study. The largest total company revenue in our study was $222.6 billion. The smallest total company revenue in our study was $0 (for each of three pharmaceutical companies that have substantial market capitalization in anticipation of future revenues). The companies in the largest size group averaged $33.8 billion in total revenue, while the companies in the smallest size group averaged $24 million. No discernible pattern exists between company size and percentage of highest-paid women executives. Number of Highest-Paid Women Executives by Company Size SIZE GROUP 1 2 3 4 5 6 7 8 9 10 AVERAGE REVENUE (IN MILLIONS) AVERAGE NUMBER OF HIGHEST-PAID EXECUTIVES $24 $86 $162 $253 $397 $597 $960 $1,713 $4,063 $33,817 COMPANIES WITH COMPANIES WITH NO WOMEN ONE WOMAN 4.4 4.3 4.4 4.5 4.9 4.7 5.0 5.0 5.1 5.2 20 28 27 27 20 28 18 28 24 19 COMPANIES WITH TWO OR MORE WOMEN 20 12 13 13 20 12 22 12 16 21 % WOMEN 2 2 4 7 2 4 5 0 6 4 12.6% 8.1% 10.2% 11.0% 11.3% 8.5% 13.5% 6.0% 11.3% 12.1% Companies in the smallest size group in our study averaged 12.6% women among their highest-paid executive officers. However, companies in the largest size group in our study averaged a virtually indistinguishable 12.1% women among their highest-paid executive officers. With the exception of one group that averaged 13.5% women, all other groups ranged between just 6% and 11.3% women among the highest-paid executive officers. Percent of Highest-Paid Women Executives by Company Size (Revenue) 16% 14% 13.5% 12.6% 12% 10.2% 10% 11.0% 11.3% 12.1% 8.5% 8.1% 8% 11.3% 6.0% 6% 4% 2% 0% 1 ($24) 2 ($86) 3 ($162) 4 ($253) 5 ($397) 6 ($597) 7 8 9 10 ($960) ($1,713) ($4,063) ($33,817) Size Group (Average Revenue in Millions) 25 2013 UC Davis Census HIGHEST-PAID WOMEN EXECUTIVES BY COMPANY SIZE We also examine firms that appear in the 2013 Fortune list, based on total revenue. Four (33.3%) of the 12 public California companies in the Fortune 100 have no women among the highest-paid executives: Apple Inc., Cisco Systems Inc., Google Inc. and Ingram Micro Inc. Three (25%) of the Fortune 100 companies have two women on their highest-paid executive teams: Hewlett-Packard Co., Wells Fargo & Co. and Safeway Inc. Despite the lack of a discernible pattern between company size and women highest-paid executives, we find that companies on more exclusive Fortune lists have greater average representation of women on their highest-paid team of executives. On average, the Fortune 100 companies have 17.7% highest-paid women executives. The Fortune 101–500 companies have an average of 10.6% highest-paid women executives and the Fortune 501–1000 companies have an average of 9.8%. Highest-Paid Women Executives in California Companies in the Fortune 1000 # HIGHEST-PAID WOMEN EXECUTIVES COMPANY NAME (FORTUNE RANK) Chevron Corp. (3) Apple Inc. (6) McKesson Corp. (14) Hewlett-Packard Co. (15) Wells Fargo & Co. (25) Intel Corp. (54) Google Inc. (55) Cisco Systems Inc. (60) Safeway Inc. (62) Walt Disney Co. (66) Ingram Micro Inc. (76) Oracle Corp. (80) 40 companies in Fortune 101—500 42 companies in Fortune 501—1000 1 0 1 2 2 1 0 0 2 1 0 1 22 21 % HIGHEST-PAID WOMEN EXECUTIVES 20.0% 0.0% 20.0% 40.0% 33.3% 20.0% 0.0% 0.0% 40.0% 20.0% 0.0% 20.0% 10.6% 9.8% Key Statistics • Companies in the largest and smallest size groups in our study have, respectively, 12.1% and 12.6% women in their highest-paid executive positions, on average. • On average, women hold 17.7% of highest-paid executive positions at Fortune 100 companies in California, 10.6% of highest-paid executive positions at Fortune 101–500 companies in California, and 9.8% of highest-paid executive positions at Fortune 501–1000 companies in California. • Despite the wide range of average company sizes across our 10 size groups, no clear positive correlation between company size and representation of women executives emerges from these data. 2013 UC Davis Census 26 HIGHEST-PAID WOMEN EXECUTIVES BY LOCATION The number of highest-paid women executives at the largest public companies in California varies considerably at the county level. Below we report the key statistics, again noting that comparisons involving counties with small numbers of companies should be made with caution. By Region Central Valley Central Coast Bay Area Southern California # Firms 2 11 222 165 % Highest-Paid Women Executives 18.2% 12.0% 11.9% 8.5% Key Statistics • Firms located in the Bay Area have more women highest-paid executives on average (11.9%) than do Southern California companies (8.5%). • Focusing on counties with at least 20 companies, San Mateo County has the greatest percentage of highest-paid women executives (15.4%), while Orange County and Los Angeles County have the lowest percentages (8.1% and 8.3%, respectively). Central Valley Sacramento Kern # Firms 1 1 % Highest-Paid Women Executives 20.0% 16.7% Central Coast Santa Cruz Santa Barbara Ventura # Firms 3 1 7 % Highest-Paid Women Executives 21.4% 20.0% 6.5% Bay Area San Mateo Alameda Marin San Francisco Santa Clara Contra Costa Sonoma # Firms 43 30 6 30 106 4 3 % Highest-Paid Women Executives 15.4% 14.3% 13.3% 11.3% 10.2% 10.0% 0.0% Southern California San Diego Los Angeles Orange Riverside San Bernardino # Firms 51 79 33 1 1 % Highest-Paid Women Executives 9.5% 8.3% 8.1% 0.0% 0.0% For complete county-by-county data, see Appendix C, page 42. 27 2013 UC Davis Census

