N
SE E G R O U
PL
H EDGE F UND A DVISORY
LC
H EN
ES
FOR IMMEDIATE RELEASE
For further information contact:
Hennessee Group LLC
212-857-4400
www.hennesseegroup.com
HEDGE FUNDS OUTPERFORM IN THE “LOST DECADE”
Hedged Equity Investing Pays Off for Investors
Tuesday, January 19, 2010 – New York, NY – Hennessee Group LLC, a consultant and adviser to direct
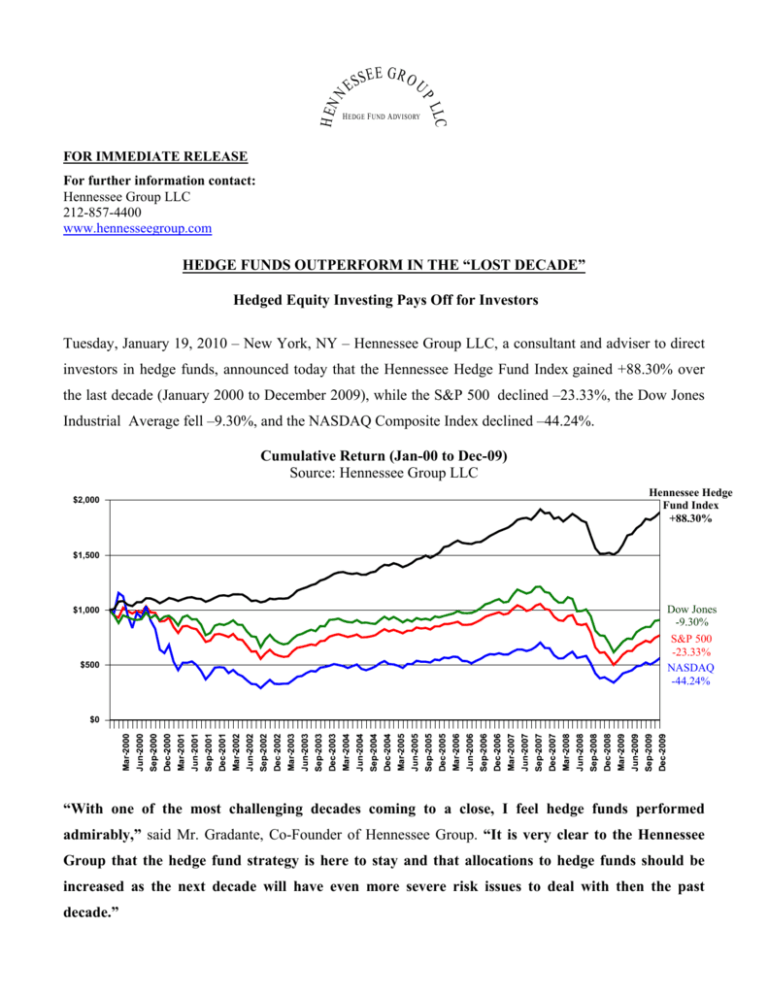
investors in hedge funds, announced today that the Hennessee Hedge Fund Index gained +88.30% over
the last decade (January 2000 to December 2009), while the S&P 500 declined –23.33%, the Dow Jones
Industrial Average fell –9.30%, and the NASDAQ Composite Index declined –44.24%.
Cumulative Return (Jan-00 to Dec-09)
Source: Hennessee Group LLC
$2,000
Hennessee Hedge
Fund Index
+88.30%
$1,500
$1,000
$500
Dow Jones
-9.30%
S&P 500
-23.33%
NASDAQ
-44.24%
$0
“With one of the most challenging decades coming to a close, I feel hedge funds performed
admirably,” said Mr. Gradante, Co-Founder of Hennessee Group. “It is very clear to the Hennessee
Group that the hedge fund strategy is here to stay and that allocations to hedge funds should be
increased as the next decade will have even more severe risk issues to deal with then the past
decade.”
“There has been a lot of talk about the ‘lost decade’ for stocks [referring to the fact that investors
lost money in stocks over the last decade]. However, there has not been much said about the
performance of hedge funds,” said Mr. Gradante. “While stocks actually declined in value at an
annualized rate of -2.62% per year [for the S&P 500], hedge funds posted an annualized positive
return of +6.54%.”
Cumulative
Return
Annualized
Return
Annualized
Volatility
Hennessee Hedge Fund Index
+88.30%
6.54%
6.81%
S&P 500
-23.33%
-2.62%
16.13%
NASDAQ
-44.24%
-5.67%
26.92%
Dow Jones Ind. Avg.
-9.30%
-0.97%
15.63%
Jan-00 to Dec-09
“Not only did hedge funds outperform stocks on a relative basis by more than +9% per year versus
the S&P 500, they did so with significantly less volatility,” said E. Lee Hennessee, Managing Principal
of Hennessee Group. “Hedge funds exhibited a standard deviation of 6.8% over the last decade
while the S&P 500 had a standard deviation of 16.1%.”
Risk vs. Return Chart (Jan-00 to Dec-09)
Source: Hennessee Group
10.00%
7.50%
Hennessee Hedge
Fund Index
5.00%
2.50%
0.00%
Dow Jones
Ind. Avg.
-2.50%
S&P 500
-5.00%
NASDAQ
-7.50%
0.00%
5.00%
10.00%
15.00%
20.00%
25.00%
30.00%
Annualized Standard Deviation
Down Market Performance
In analyzing the performance of the Hennessee Hedge Fund Index, the ability to outperform over the past
ten years was in large part due to the ability to minimize drawdowns. The Hennessee Hedge Fund Index
experienced only two down years (2002 and 2008), while the S&P 500 had four down years (2000, 2001,
2002, and 2008).
This is also evident when analyzing the monthly returns of the Hennessee Hedge Fund Index versus the
S&P 500. In months when the S&P 500 generated a positive return, hedge funds were able to capture
slightly more than 50% of the upside (+1.6% for the Hennessee Hedge Fund Index versus +3.0% for the
S&P 500). In months when the S&P 500 declined in value, hedge funds only participated in -20% of
the loss (-0.8% for the Hennessee Hedge Fund Index versus -4.2% for the S&P 500). This ability to
protect capital in the down markets allowed hedge funds to average a positive monthly return of +0.5%,
while the S&P 500 declined in value at an average monthly rate of -0.1%. This helped hedge funds
compound higher absolute returns relative to traditional equity benchmarks with less volatility.
Average Monthly Return (Jan-00 to Dec-09)
Source: Hennessee Group LLC
4.0%
3.0%
3.0%
1.6%
2.0%
1.0%
0.5%
0.0%
-0.1%
-1.0%
-0.8%
-2.0%
-3.0%
-4.0%
-4.2%
-5.0%
All Months
Hennessee Hedge Fund Index
Up Months
Down Months
S&P 500
“This down market analysis demonstrates that you do not need to outperform in up months in
order to outperform,” said Mr. Gradante. “The most value-added characteristic of hedge funds is
their down side risk management, which is really where they generate alpha.”
Hedge Fund Strategies & Managers
By selecting either the top performing hedge fund strategies or by selecting the top performing hedge fund
managers, investors were able to outperform the overall Hennessee Hedge Fund Index and other
benchmarks by a significant margin.
The top performing strategies over the past decade were: 1) Financial Equities funds, which performed
well in 2008, as they were able to foresee many of the financial problems and generate gains shorting, and
well in 2009 participating in a sharp snapback; 2) Healthcare and Biotech funds, which posted outsized
years in 2000, 2003 and 2009; and 3) Distressed funds, which posted strong performance after default
cycles in 2003, 2004 and 2009.
Annualized Return
Cumulative Return
1. Hennessee Financial Equities Index
+11.8%
+206.0%
2. Hennessee Healthcare and Biotech Index
+9.1%
+138.5%
3. Hennessee Distressed Index
+8.9%
+134.8%
Jan-00 to Dec-09
This analysis also demonstrates the need for experienced hedge fund manager selection. An average
hedge fund that performed in the top half of the Hennessee Hedge Fund Index each year over the past ten
years significantly outperformed a hedge fund that performed in the bottom half.
Annualized Return
Cumulative Return
Top Half Performer
16.10%
444.70%
Bottom Half Performer
-5.50%
-43.20%
Jan-00 to Dec-09
* It should be noted that many funds did not perform in the top half every year or the bottom half every year.
*************************************************************************************
For more information on hedge fund strategy performance in 2009, please see the Hennessee Hedge
Fund Review, our monthly hedge fund publication, at: http://www.hennesseegroup.com/hhfr/index.html.
About the Hennessee Group LLC
Hennessee Group LLC is a Registered Investment Adviser that consults direct investors in hedge funds on asset allocation, manager
selection, and ongoing monitoring of hedge fund managers. Hennessee Group LLC is not a tracker of hedge funds. The Hennessee Hedge
®
Fund Indices are for the sole purpose of benchmarking individual hedge fund manager performance. The Hennessee Group does not sell a
hedge fund-of-funds product nor does it market individual hedge fund managers.
For additional Hennessee Group Press Releases, please
visit the Hennessee Group’s website. The Hennessee Group also publishes the Hennessee Hedge Fund Review monthly, which provides a
comprehensive hedge fund performance review, statistics, and market analysis; all of which is value added to hedge fund managers and
investors alike.
®
Description of Hennessee Hedge Fund Indices
®
The Hennessee Hedge Fund Indices are calculated from performance data reported to the Hennessee Group by a diversified group of over
®
1,000 hedge funds. The Hennessee Hedge Fund Index is an equally weighted average of the funds in the Hennessee Hedge Fund Indices .
The funds in the Hennessee Hedge Fund Index are derived from the Hennessee Group’s database of over 3,500 hedge funds and are net of
fees and unaudited. Past performance is no guarantee of future returns. ALL RIGHTS RESERVED. This material is for general information
only and is not an offer or solicitation to buy or sell any security including any interest in a hedge fund.


