section notes on convective stability
advertisement
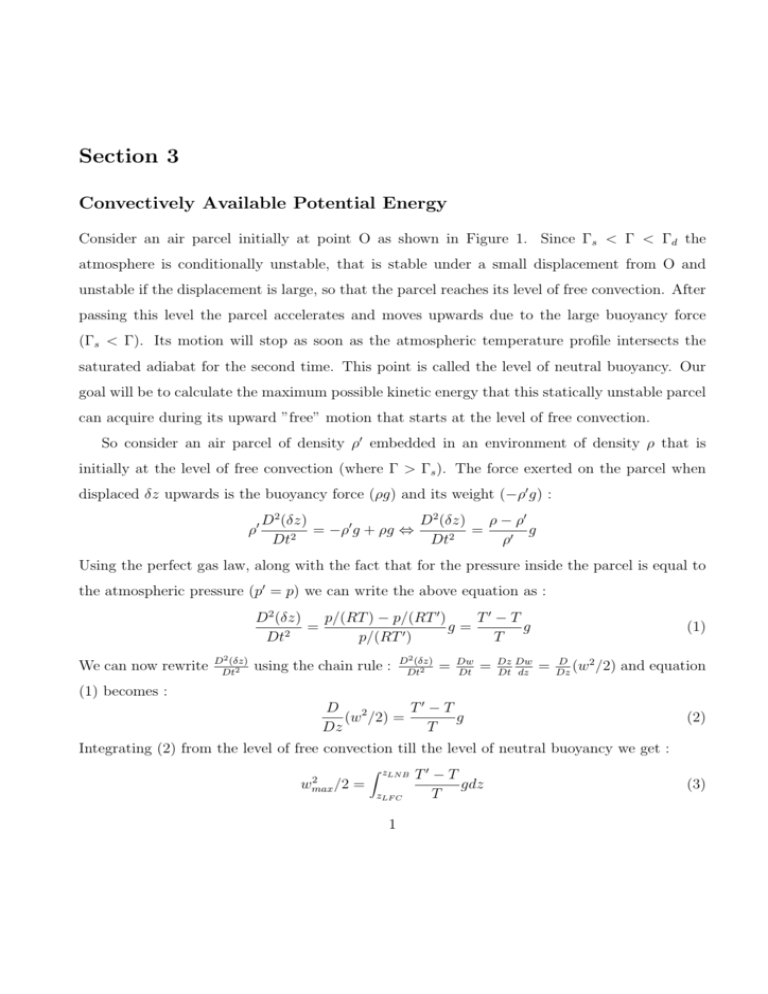
Section 3 Convectively Available Potential Energy Consider an air parcel initially at point O as shown in Figure 1. Since Γs < Γ < Γd the atmosphere is conditionally unstable, that is stable under a small displacement from O and unstable if the displacement is large, so that the parcel reaches its level of free convection. After passing this level the parcel accelerates and moves upwards due to the large buoyancy force (Γs < Γ). Its motion will stop as soon as the atmospheric temperature profile intersects the saturated adiabat for the second time. This point is called the level of neutral buoyancy. Our goal will be to calculate the maximum possible kinetic energy that this statically unstable parcel can acquire during its upward ”free” motion that starts at the level of free convection. So consider an air parcel of density ρ0 embedded in an environment of density ρ that is initially at the level of free convection (where Γ > Γs ). The force exerted on the parcel when displaced δz upwards is the buoyancy force (ρg) and its weight (−ρ0 g) : ρ0 D2 (δz) ρ − ρ0 D2 (δz) 0 = −ρ g + ρg ⇔ = g Dt2 Dt2 ρ0 Using the perfect gas law, along with the fact that for the pressure inside the parcel is equal to the atmospheric pressure (p0 = p) we can write the above equation as : D2 (δz) p/(RT ) − p/(RT 0 ) T0 − T = g = g Dt2 p/(RT 0 ) T We can now rewrite D2 (δz) Dt2 using the chain rule : D2 (δz) Dt2 = Dw Dt = Dz Dw Dt dz (1) = D (w2 /2) Dz and equation (1) becomes : T0 − T D 2 (w /2) = g Dz T (2) Integrating (2) from the level of free convection till the level of neutral buoyancy we get : 2 wmax /2 = Z zLN B 0 T −T zLF C 1 T gdz (3) This is the the Convectively Available Potential Energy (CAPE) and you can estimate it graphically by the size of the area enclosed by the saturated adiabat and the observed temperature profile. Typical values for CAPE are of the order of 500m2 /sec2 yielding values of the order of 5 − 10m/sec. You should compare this to typical values for vertical velocity outside the cloud, of the order of cm/sec. 2 20 18 LNB 16 14 Γs Γ z 12 Γd 10 LFC 8 6 LCL 4 O 2 0 −70 −60 −50 −40 −30 −20 −10 Temperature 0 10 20 30 40 Figure 1: Vertical profile of atmospheric temperature (dashed line). The dry and saturated adiabat are also plotted (solid lines). The particle is initially forced to move from point O until the level of free convection following the dry adiabat until its lifting condensation level and then the saturated adiabat. After it reaches the lifting condensation level and can accelerate on its own due to the large buoyancy force. 3
