A GUIDE TO THE SKEW-T / LOG
advertisement
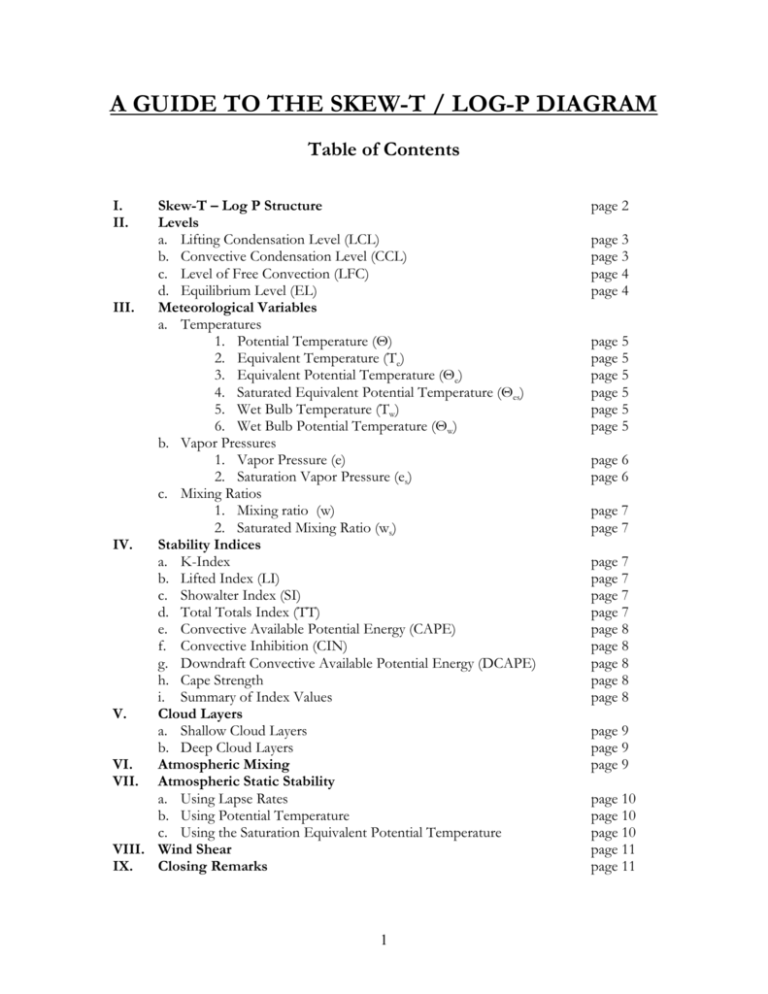
A GUIDE TO THE SKEW-T / LOG-P DIAGRAM Table of Contents I. II. Skew-T – Log P Structure Levels a. Lifting Condensation Level (LCL) b. Convective Condensation Level (CCL) c. Level of Free Convection (LFC) d. Equilibrium Level (EL) III. Meteorological Variables a. Temperatures 1. Potential Temperature (Θ) 2. Equivalent Temperature (Te) 3. Equivalent Potential Temperature (Θe) 4. Saturated Equivalent Potential Temperature (Θes) 5. Wet Bulb Temperature (Tw) 6. Wet Bulb Potential Temperature (Θw) b. Vapor Pressures 1. Vapor Pressure (e) 2. Saturation Vapor Pressure (es) c. Mixing Ratios 1. Mixing ratio (w) 2. Saturated Mixing Ratio (ws) IV. Stability Indices a. K-Index b. Lifted Index (LI) c. Showalter Index (SI) d. Total Totals Index (TT) e. Convective Available Potential Energy (CAPE) f. Convective Inhibition (CIN) g. Downdraft Convective Available Potential Energy (DCAPE) h. Cape Strength i. Summary of Index Values V. Cloud Layers a. Shallow Cloud Layers b. Deep Cloud Layers VI. Atmospheric Mixing VII. Atmospheric Static Stability a. Using Lapse Rates b. Using Potential Temperature c. Using the Saturation Equivalent Potential Temperature VIII. Wind Shear IX. Closing Remarks 1 page 2 page 3 page 3 page 4 page 4 page 5 page 5 page 5 page 5 page 5 page 5 page 6 page 6 page 7 page 7 page 7 page 7 page 7 page 7 page 8 page 8 page 8 page 8 page 8 page 9 page 9 page 9 page 10 page 10 page 10 page 11 page 11 I. Skew-t Structure The skew-t – log P diagram is the most commonly used thermodynamic diagram within the United States. A large number of meteorological variables, indices, and atmospheric conditions can be found directly or through simple analytical procedures. Typically, the environmental temperature, dewpoint temperature, wind speed and wind direction at various pressure levels are plotted on the diagram. This plot is commonly called a ‘sounding’. Sounding data come from weather balloons that are launched around the country at 00Z and 12Z, as well as various special situations in which they are used in field experiments and other campaigns. Figure 1 is an example skew-t-log P diagram. Figure 1: Skew-T - Log P Thermodynamic Diagram Let’s take a closer look at Figure 1 and identify the lines on the skew-t diagram. Figure 2 is a close up of the lower right corner of the diagram in Figure 1. Each line is labeled accordingly. The solid 2 diagonal lines are isotherms, lines of constant temperature. Temperatures are in degrees Celsius, and a Fahrenheit scale is also at the bottom of the diagram. The dashed lines are mixing ratios. The dry adiabats on the diagram are the curved lines with the lesser slope and are drawn at 2° intervals. Moist adiabats have a much greater slope and follow much more vertical path on the skew-t diagram. Two height scales are located on the right side of the diagram. The left scale is the height in meters and the right scale is height in thousands of feet. Pressure levels are in millibars (mb)/hectopascals (hPa). Figure 2: A closeup of a skew-t diagram presents the various definitions of lines located on the diagram. II. Levels a. Lifting Condensation Level (LCL): The level at which a parcel of air first becomes saturated when lifted dry adiabatically. This level can be found by finding the intersection of the dry adiabat through the temperature at the pressure level of interest, and the mixing ratio through the dewpoint temperature at the pressure level of interest (Figure 3). b. Convective Condensation Level (CCL): The level that a parcel, if heated sufficiently from below, will rise adiabatically until it is saturated. This is a good estimate for a cumuliform cloud base from surface heating. To find the convective condensation level, find the intersection of the mixing ratio 3 through the dewpoint temperature at the pressure level of interest and the temperature sounding (Fig 3). c. Level of Free Convection (LFC): The level in which a parcel first becomes positively buoyant. To find the level of free convection, find the lifting condensation for the level of interest, and find the intersection of the moist adiabat that goes through the LCL, and the temperature curve (Figure 3). d. Equilibrium Level (EL): The point at which a positively buoyant parcel becomes negatively buoyant, which typically will occur in the upper troposphere. To find this level, find the level of free convection, follow the moist adiabat through this level of free convection up until it intersects the temperature sounding again. This point is the equilibrium level (Figure 3). Figure 3: An example skew-t showing the levels and energies defined in section 2. 4 III. Meteorological Variables As stated before, a sounding can allow the user determine values of many meteorological variables, making it one of the most useful resources for meteorologists. A variety of temperatures, mixing ratios, vapor pressures, stability indices, and conditions can be derived from temperature and dewpoint temperature soundings on a skew-t. III.a. Temperatures 1. Potential Temperature (Θ): Potential temperature is the temperature a parcel of air would have it were lifted (expanded) or sunk (compressed) adiabatically to 1000mb. The value of the potential temperature is the temperature of the dry adiabat that runs through the temperature at the pressure level of interest, at 1000mb (Figure 4). 2. Equivalent Temperature (Te): The equivalent temperature is the temperature of a parcel if, via a moist adiabatic process, all moisture was condensed into the parcel. Finding the equivalent temperature is slightly more difficult. To find Te, follow the moist adiabat that runs through the lifting condensation level at the pressure level of interest to a pressure level in which the moist adiabat and dry adiabat have similar slopes, then go down the dry adiabat at this point back down to the original pressure level of interest; this temperature is the equivalent temperature. If the dry adiabat continues beyond the boundary of the skew-t in which it can not be determined, an alternative is to read off the temperature scale that runs diagonally in the middle of the skew-t (Figure 4). 3. Equivalent Potential Temperature (Θe): The equivalent potential temperature is similar to the equivalent temperature however after the moisture has been condensed out of the parcel, the parcel is brought down dry adiabatically to 1000mb. The process to find the equivalent potential temperature is the same as the regular equivalent temperature however when the parcel is brought down the dry adiabat it continues past the original pressure level and is brought down to 1000mb. The temperature at this intersection is the equivalent potential temperature. 4. Saturated Equivalent Potential Temperature (Θes): The temperature at which an unsaturated parcel would have if it were saturated. To find the saturated equivalent potential temperature, use a similar process used for determining the equivalent potential temperature however one must follow the moist adiabat through the environmental temperature at the necessary pressure level, unlike using the lifting condensation level for equivalent potential temperature (Figure 4). 5. Wet-bulb Temperature (Tw): The minimum temperature at which a parcel of air can obtain by cooling via the process of evaporating water into it at constant pressure. To find the wet-bulb temperature follow the moist adiabat through the lifting condensation level and find the temperature of the intersection of this moist adiabat with the original pressure level of interest (Figure 4). 6. Wet-bulb Potential Temperature (Θw): Similar to the wet-bulb temperature, however the parcel is then brought down dry adiabatically to 1000mb. To find the wet-bulb temperature, use similar means as the regular potential temperature, however continue down the moist adiabat through the lifting condensation level through the original pressure level to 1000mb and read the temperature at the intersection of the moist adiabat and the 1000mb pressure level (Figure 4). 5 Figure 4: This figure shows the methods of finding the temperatures mentioned in this section. III. b. Vapor Pressures 1. Vapor Pressure (e): The amount of atmospheric pressure that is a result of the pressure from water vapor in the atmosphere. To find the vapor pressure follow an isotherm (a line parallel to an isotherm) through the dewpoint temperature at the pressure level of interest, up to 622mb. The value of the mixing ratio at this intersection is the vapor pressure in millibars. 2. Saturated Vapor Pressure (es): The amount of atmospheric pressure that is a result of the pressure of water vapor in saturated air. This quantity can be found using similar means as the vapor pressure however one must follow a parallel isotherm through the temperature at the pressure level of interest. 6 III.c. Mixing Ratios 1. Mixing Ratio (w): The mixing ratio is the ratio of the mass of water vapor in the air over the mass of dry air. This quantity is found by reading the mixing ratio line that goes through the dewpoint temperature at the pressure level of interest. 2. Saturated Mixing Ratio (ws): A similar mixing ratio as above, however it is the mixing ratio of a saturated parcel of air at a given temperature and pressure. It can be found by finding the value of the mixing ratio through the temperature at a pressure level of interest. IV. Stability Indices a. K-index: Used for determining what the probability and spatial coverage of ordinary thunderstorms would be based on temperature and dewpoint temperature. K = T850 + Td850 + Td700 - T700 – T500 For K > 35, numerous thunderstorms are likely. For K values between 31 and 35, scattered thunderstorms may occur. For K values between 26 and 30 widely scattered thunderstorms are probable. For K values between 20 and 25, isolated thunderstorms are probable, and below 20, thunderstorm will only have a small chance to develop. A summary of these values are in Table 1. b. Lifted Index (LI): If storms form, this is an index that indicates the severity of the storms. LI = T500 - Tp850 Tp is the temperature of a parcel of air lifted to 500mb moist adiabatically from the surface lifting condensation level. T500 is the environmental temperature at this level. LI > - 2 is only a slight severity, LI from -3 to -5 has a much strong severity, and the strongest severity are values with LI < -5. A summary of these values are in Table 2. c. Showalter Index (SI): This is similar to the LI however the level of interest is the 850mb pressure level. SI = T850 – Tp850 This index is good for indicating elevated thunderstorms which are not picked up by the lifted index. d. Total Totals Index (TT): This gives an indication for the probability of seeing severe thunderstorm activity. TT = T850 + Td850 – 2T500 Values of TT above 52 indicate a high probability of thunderstorms, in which many of the thunderstorms will become severe. Values between 48 and 52 indicate the possibility exists for severe thunderstorms. Values between 44 and 48 indicate the probability for scattered 7 thunderstorms with only a low probability of severe thunderstorms. Finally, values lower than that 44 indicate that only normal thunderstorms will occur. e. Convective Available Potential Energy (CAPE): The amount of potential energy that a parcel can obtain from environmental conditions. Mathematically, it is the area between the level of free convection and the equilibrium level. In order to identify CAPE on a sounding, find the level of free convection and follow the moist adiabat through this level up to the equilibrium level. The area between this curve and the temperature curve is positive area, CAPE (Figure 1). f. Convective Inhibition (CIN): Amount of energy from the environmental conditions that are required for a parcel to reach the level of free convection. This is considered to be opposite that of the CAPE, whereas it is called negative area. It is a requirement for strong thunderstorms to occur. The CIN is proportional to the area between the temperature curve and a parcels ascent via both a dry and moist adiabatically lapse rates (Figure 1). g. Downdraft Convective Available Potential Energy (DCAPE): This is proportional to the amount of energy that a saturated downdraft would have while falling to the surface. It is found by finding the lifting condensation level at 600mb, descending the moist adiabat through this level down to the surface, and is proportional to the area that is between this line and the temperature curve (Figure 1). h. Cap Strength: The cap strength and can measure thunderstorm initiation. It is defined as the maximum temperature deficit within the levels below the level of free convection. Values > 2K would be considered large, and thunderstorm initiation unlikely. i, j,k. Summary of K-Index and Lifted Index: K-INDEX K-value lower bound less than 20 20 26 31 greater than 35 LIFTED INDEX (LI) K-value upper bound 25 30 35 LI Lower Bound greater than -2 -3 greater than -5 Thunderstorm Coverage Rare Isolated Widely Scattered Scattered Numerous LI Upper Bound -5 Storm Severity Weak Strong very strong TT INDEX TT-value lower bound less than 44 44 48 greater than 52 TT-value upper bound 48 52 Severe Thunderstorm Probability Unlikely Scattered, non-severe Few severe Many severe V. Cloud Layers Skew-t – Log P diagrams readily allow the user to determine possible cloud layers in the atmosphere. Cloud layers are indicated by locations in which the dewpoint temperature is very close 8 to the regular temperature. This means that the air is near saturation and a cloud may exist. A shallow cloud layer is seen when the two temperature curves are only near each other for a short vertical layer. Deep cloud layers can be identified by locations in which the dewpoint temperature and regular temperature curves are near the same magnitude for deep vertical layers in the atmosphere. Furthermore, one can identify cloud cover by noticing a sudden drop in the dewpoint temperature. This represents the condensation of water vapor into cloud drops. Another way to look at it is that a cloud is located in a region in which there is a significant drop in mixing ratio as well. One will recall that the mixing ratio is defined to be the ratio of the mass of water vapor to the mass of dry air. As water condenses into cloud drops, the mass of water vapor decreases, and thus the mixing ratio decreases. VI. Atmospheric Mixing In the morning, when solar radiation warms the Earth, warm pockets of air become positively buoyant and rise, and upon reaching a level aloft, will eventually become negatively buoyant and fall. This process is called turbulence and one of the consequences of turbulence in the atmosphere is mixing. During the afternoon, typically mixing will reach a peak, and when this occurs many meteorological variables become constant. Using a skew-t – Log P diagram, one can determine just how well mixed the atmosphere is using two methods. When the atmosphere has reached a point in which mixing is at a maximum, the mixing ratio and potential temperature will be relatively constant with height. A dewpoint curve that runs parallel to a mixing ratio line (typically dashed on a skew-t) is considered constant mixing ratio. Constant potential temperature occurs when the temperature sounding is close to that of slope of the dry adiabat. An example of a well mixed atmosphere can be seen in Figure 5. Notice the constant potential temperature (the temperature sounding almost parallels the dry adiabat) and the mixing ratio is constant with height. This indicates that the atmosphere is very well mixed, particularly the atmosphere up to 650mb. This sounding is from Amarillo, Texas during July. To see a profile with this ideal look is not uncommon during the summer months when strong daytime heating causes a very large amount of turbulence in the atmosphere. A second approach to determining how well mixed the atmosphere is for a particular sounding is to find the lifting condensation level for the surface temperature and surface dewpoint temperature and compare it to the actual observed cloud base at that time. If these two levels compare to each other, then the atmosphere is very well mixed. Large variations in these two levels indicate only a moderate mixing in the atmosphere. 9 Figure 5: A well mixed atmosphere in the levels from the surface to 650mb. VII. Atmospheric Static Stability Identification of layers that are unstable, stable, or neutrally stable is important for identifying how high buoyant parcels of air will rise in the atmosphere. Unstable layers will promote and enhance positive buoyancy and stable layers will tend to cease lifting and cause parcels to be come negatively buoyant. A neutrally stable layer will have no net effect on the buoyancy of a parcel of air. A conditionally unstable layer, depending on the environment can have a positive or negative affect on a parcel’s buoyancy. There are a few methods for determining the stability of a layer in the atmosphere, using lapse rates, using potential temperature, and or the saturated equivalent potential temperature. a.Using Lapse Rates: The necessary lapse rates for determining stability are the moist adiabatic lapse rate, the dry adiabatic lapse rate, and the environmental lapse rate of the layer of interest. The following are the conditions for stability by comparing the environmental lapse rates to the dry and moist adiabatic lapse rate. Absolutely Stable Conditionally Unstable Absolutely Stable Г > Гw Гd > Г > Гw Г > Гd b.Using Potential Temperature: The conditions for stability using the change in potential temperature with height are as follows: ∂Θ > 0 Stable ∂z ∂Θ = 0 Neutral ∂z ∂Θ < 0 Unstable ∂z c.Using Saturation Equivalent Potential Temperature: The conditions for static stability using the change in saturation equivalent potential temperature with height are the following: ∂Θes > 0 Stable ∂z ∂Θes < 0 Conditionally Unstable ∂z 10 VIII. Wind Shear Often times the wind speed and direction are plotted on a skew-t diagram on the left edge of the diagram, near the height axis. This plot can be used to determine levels of strong wind shear. Wind shear has two components: speed shear and directional shear. Speed shear is defined as an abrupt increase or decrease in wind speed in a relatively short distance, and directional shear is defined as an abrupt change in wind direction over a relatively short distance. One determines these conditions by interpreting the wind plots on the skew-t diagram. The amount of shear in the atmosphere is critical for the development of strong thunderstorms, and is producers of waves in the atmosphere. IX. Closing Remarks The use of the skew-t is a very important resource to understand the current state of the atmosphere and, in addition, the forecasted state of the atmosphere. A forecasted skew-t can be just as good as a spatial model that is typically viewed when making a forecast. Various critical meteorological variables can be determined, cloud layer depth and height can be found, and severe weather probabilities and coverage can be derived from the skew-t diagram. Likewise, wind shear and static stabilities can be calculated from the skew-t diagram. 11
