Sample business plan financial projections and pro
advertisement
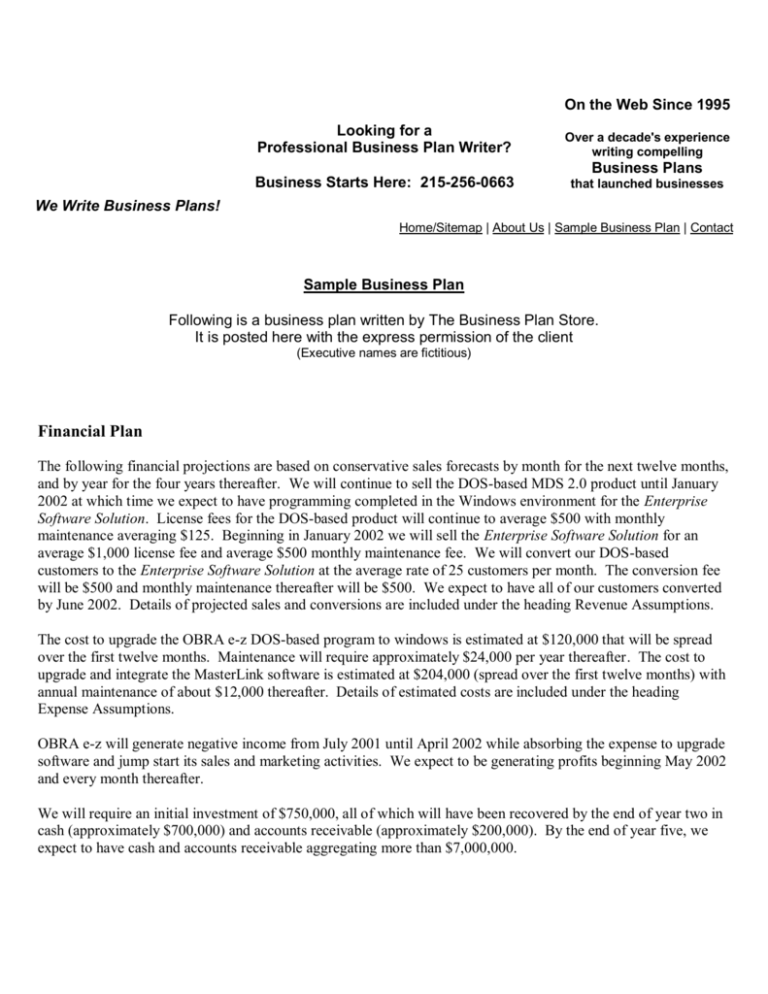
On the Web Since 1995 Looking for a Professional Business Plan Writer? Over a decade's experience writing compelling Business Starts Here: 215-256-0663 that launched businesses Business Plans We Write Business Plans! Home/Sitemap | About Us | Sample Business Plan | Contact Sample Business Plan Following is a business plan written by The Business Plan Store. It is posted here with the express permission of the client (Executive names are fictitious) Financial Plan The following financial projections are based on conservative sales forecasts by month for the next twelve months, and by year for the four years thereafter. We will continue to sell the DOS-based MDS 2.0 product until January 2002 at which time we expect to have programming completed in the Windows environment for the Enterprise Software Solution. License fees for the DOS-based product will continue to average $500 with monthly maintenance averaging $125. Beginning in January 2002 we will sell the Enterprise Software Solution for an average $1,000 license fee and average $500 monthly maintenance fee. We will convert our DOS-based customers to the Enterprise Software Solution at the average rate of 25 customers per month. The conversion fee will be $500 and monthly maintenance thereafter will be $500. We expect to have all of our customers converted by June 2002. Details of projected sales and conversions are included under the heading Revenue Assumptions. The cost to upgrade the OBRA e-z DOS-based program to windows is estimated at $120,000 that will be spread over the first twelve months. Maintenance will require approximately $24,000 per year thereafter. The cost to upgrade and integrate the MasterLink software is estimated at $204,000 (spread over the first twelve months) with annual maintenance of about $12,000 thereafter. Details of estimated costs are included under the heading Expense Assumptions. OBRA e-z will generate negative income from July 2001 until April 2002 while absorbing the expense to upgrade software and jump start its sales and marketing activities. We expect to be generating profits beginning May 2002 and every month thereafter. We will require an initial investment of $750,000, all of which will have been recovered by the end of year two in cash (approximately $700,000) and accounts receivable (approximately $200,000). By the end of year five, we expect to have cash and accounts receivable aggregating more than $7,000,000. Break-even Analysis The break-even analysis assumes running costs of approximately $91,700 per month that includes full payroll (compensation and benefits), rent, utilities, supplies, sales and marketing, training, and other miscellaneous costs. Variable costs include only those directly attributable to packaging and delivering the software product and are estimated to average only about 10% of the license revenue. The chart shows the break-even revenue is about $94,500 per month. Conservatively, we estimate that by May 2002 we will be servicing a minimum of 165 customers of $73,125 and license fees of $22,500. We will have crossed the break-even point in May and project profitability thereafter. Pro forma financial statements follow. Pro Forma Income Statements – Year 1 by Month Licenses Jul Aug Sep Oct Nov $5,000 $5,000 $5,000 $5,000 $5,000 $5 Maintenance Sales Cost of Goods Sold Gross Profit Software Development - OBRA e-z Software Development - MasterLink Salaries Selling Expense Office Expense Other Total SG & A Expense Operating Profit Interest Income Earnings Before Taxes Income Taxes Extraord. Item: Tax Refund Net Income 8,125 13,125 500 12,625 9,375 14,375 500 13,875 10,625 15,625 500 15,125 11,875 16,875 500 16,375 13,125 18,125 500 17,625 14 19 10,000 17,000 48,500 10,000 5,200 1,000 91,700 (79,075) 10,000 17,000 48,500 10,000 5,200 1,000 91,700 (77,825) 10,000 17,000 48,500 10,000 5,200 1,000 91,700 (76,575) 10,000 17,000 48,500 10,000 5,200 1,000 91,700 (75,325) 10,000 17,000 48,500 10,000 5,200 1,000 91,700 (74,075) 10 17 48 10 5 1 91 (72 0 (79,075) 0 0 ($79,075) 2,361 (75,464) 0 0 ($75,464) 2,077 (74,498) 0 0 ($74,498) 1,796 (73,529) 0 0 ($73,529) 1,515 (72,560) 0 0 ($72,560) 1 (71 Pro Forma Income Statements – Years 1 through 5 Licenses Total Y1 Y2 Y3 Y4 Y5 $152,500 $150,000 $200,000 $250,000 $250,000 Maintenance 376,875 1,500,000 2,550,000 3,900,000 5,400,000 Sales 529,375 1,650,000 2,750,000 4,150,000 5,650,000 Cost of Goods Sold 15,250 15,000 20,000 25,000 25,000 Gross Profit 514,125 1,635,000 2,730,000 4,125,000 5,625,000 Software Development - OBRA e-z 120,000 24,000 24,000 24,000 24,000 Software Development MasterLink 204,000 12,000 12,000 12,000 12,000 Salaries Selling Expense 582,000 120,000 611,100 120,000 641,655 126,000 673,738 132,300 707,425 138,915 18 ($71 Office Expense 62,400 62,400 65,520 68,796 72,236 Other 12,000 12,000 12,600 13,230 13,892 Total SG & A Expense 1,100,400 841,500 881,775 924,064 968,468 Operating Profit (586,275) 793,500 1,848,225 3,200,936 4,656,532 Interest Income 11,787 Earnings Before Taxes (574,488) 1,981 2,393 278,418 Extraord. Item: Tax Refund 2,393 201,071 ($574,488) 79,228 167,624 795,481 1,878,438 3,280,164 4,824,157 Income Taxes Net Income 30,213 657,453 1,148,058 1,688,455 0 0 0 $718,133 $1,220,985 $2,132,107 $3,135,702 Pro Forma Balance Sheets – Year 1 by Month Jul Aug Sep Oct Nov Dec $25,000 629,695 16,480 671,175 $25,000 553,911 16,800 595,711 $25,000 479,026 17,188 521,214 $25,000 404,122 18,563 447,685 $25,000 330,188 19,938 375,125 $25,000 257,226 21,313 303,539 $671,175 $595,711 $521,214 $447,685 $375,125 $303,539 Accounts Payable Total Current Liabilities 250 250 250 250 250 250 250 250 250 250 250 250 Total Liabilities 250 250 250 250 250 250 (79,075) 750,000 $671,175 (154,539) 750,000 $595,711 (229,036) 750,000 $521,214 (302,565) 750,000 $447,685 (375,125) 750,000 $375,125 (446,711) 750,000 $303,539 Cash Marketable Securities Accounts Receivable Total Current Assets Total Assets Retained Earnings Other Equity Total Liabilities and Equity $ (5 $ Pro Forma Balance Sheets – Years 0 Through 5 Y0 Cash Marketable Securities Accounts Receivable Total Current Assets Y1 Y2 Y3 $25,000 44,012 107,250 176,262 $671,175 $176,262 Accounts Payable Total Current Liabilities 250 250 750 750 750 750 1,000 1,000 1,250 1,250 1,250 1,250 Total Liabilities 250 750 750 1,000 1,250 1,250 (79,075) (574,488) 750,000 750,000 143,645 750,000 1,364,630 750,000 3,496,736 750,000 6,632,438 750,000 Retained Earnings Other Equity Total Liabilities and Equity $671,175 $176,262 $25,000 1,760,630 330,000 2,115,630 Y5 $25,000 629,695 16,480 671,175 Total Assets $25,000 671,395 198,000 894,395 Y4 $25,000 3,724,986 498,000 4,247,986 $25,000 6,680,688 678,000 7,383,688 $894,395 $2,115,630 $4,247,986 $7,383,688 $894,395 $2,115,630 $4,247,986 $7,383,688 Pro Forma Cash Flow Statements – Year 1 by Month Jul Aug Sep Oct Nov De Operating Profit ($79,075) Cash Income Taxes 0 Funds From Opers. After Tax (79,075) Increm. Working Capital Invest. 41,230 Cash Flow From Operations ($120,305) ($77,825) 0 (77,825) 320 ($78,145) ($76,575) 0 (76,575) 388 ($76,963) ($75,325) 0 (75,325) 1,375 ($76,700) ($74,075) 0 (74,075) 1,375 ($75,450) ($72,825 2,361 0 ($75,784) 2,077 0 ($74,885) 1,796 0 ($74,904) 1,515 0 ($73,935) 1,23 Non Op Inc. (after tax) Investor(s) Net Cash Flow -1) 0 750,000 $629,695 (1- After-tax interest income Pro Forma Cash Flow Statements – Years 1 through 5 Total Y1 Operating Profit ($586,275) Y2 Y3 Y4 Y5 $793,500 $1,848,225 $3,200,936 $4,656,532 (72,825 1,37 ($74,200 ($72,962 Cash Income Taxes Funds From Opers. After Tax Increm. Working Capital Invest. Cash Flow From Operations Non Op Inc. (after tax) Investor(s) Net Cash Flow -1) 0 (586,275) 77,155 716,345 646,879 1,201,346 1,629,786 3,026,746 131,500 ($717,775) 90,750 131,750 167,750 180,000 $625,595 $1,069,596 $1,912,858 $2,846,744 11,787 750,000 $44,012 1,788 19,638 51,498 108,956 0 0 0 0 $627,383 $1,089,235 $1,964,357 $2,955,702 (1- After-tax interest income We write business plans! To get started on yours, contact us here. The Business Plan Store 201 Alderfer Road, Suite 300 Harleysville, PA 19438 Call Us: 215-256-0663 1995-2009 The Business Plan Store 1,120,328 2,080,608
