Cairo TraffiC CongesTion sTudy ExEcutivE NotE May
advertisement
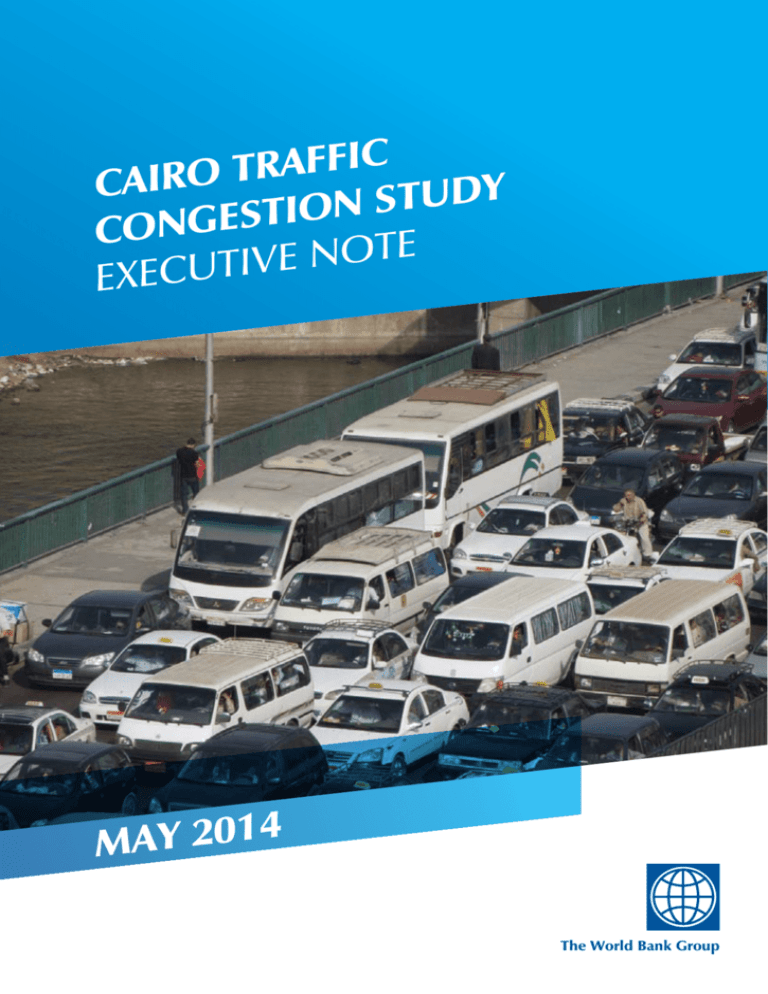
C i f f a r T Cairo y d u T s n o i T s e g Con E t o N E ExEcutiv 4 1 0 2 y a M The World Bank group The World Bank Group Acknowledgments This study was undertaken by a World Bank team led by Ziad Nakat (Transport Specialist) and including Santiago Herrera (Lead Economist) and Yassine Cherkaoui (Infrastructure Specialist), and it was executed by Ecorys in collaboration with Sets and Cambridge Systematics. Funding for the study was generously provided by the Government of Netherlands; the Multi Donor Trust Fund “Addressing Climate Change in the Middle East and North Africa (MENA) Region” supported by Italy’s Ministry of Foreign Affairs and the European Commission; the Energy Sector Management Assistance Program and the World Bank. 1 Cairo Traffic Congestion Study I Executive Note I. Introduction The Greater Cairo Metropolitan Area (GCMA), with more than 19 million inhabitants, is host to more than one-fifth of Egypt’s population. The GCMA is also an important contributor to the Egyptian economy in terms of GDP and jobs. The population of the GCMA is expected to further increase to 24 million by 2027, and correspondingly its importance to the economy will also increase. Traffic congestion is a serious problem in the GCMA with large and adverse effects on both the quality of life and the economy. In addition to the time wasted standing still in traffic, time that could be put to more productive uses, congestion results in unnecessary fuel consumption, causes additional wear and tear on vehicles, increases harmful emissions lowering air quality, increases the costs of transport for business, and makes the GCMA an unattractive location for businesses and industry. These adverse effects have very real and large monetary and nonmonetary costs not only for the economy of the GCMA, but given its size, for the economy of Egypt as well. As the population of the GCMA continues to increase, traffic congestion is becoming worse and the need to address this congestion is becoming more urgent. In recognition of the seriousness of the problem of traffic congestion, and upon the request of Government, primarily the Ministries of Finance, Transport, Housing, and Interior, the World Bank funded an investigation into its magnitude, causes, and potential solutions in the GCMA. The objective of the study was intended to conduct a macro-level investigation of congestion in the GCMA: its magnitude, causes, associated economic costs, and potential solutions. This report documents the results of the study. The results of this study should be of interest to policy-makers and practitioners in the GCMA, the Egyptian Government, other cities facing similar problems, and international financial institutions. II. Causes of Congestion in GCMA CURRENT TRAFFIC SITUATION IN GCMA The study area for GCMA spans the governorates of Cairo, Giza, and Qalyobiyain, and includes the new cities of New Cairo City, 6th of October City, 15th May City, 10th of Ramadan City, El-Obour City, and Badr City. A number of traffic surveys as well as consultations with experts and stakeholders were undertaken to assess the traffic situation in GCMA. Traffic volumes are in the range of 3,000 to 7,000 veh/hr per lane on major corridors, with the 6th of October bridge and the Ring Road at Carrefour al Maadi witnessing some of the highest volumes (about 7,000 veh/hr per lane per direction for AM and PM peaks). For the surveyed local streets, volumes are in the range of 1,000 to 4,000 veh/hr per lane with the highest volumes observed on Al Dogi street and Gasr Al Suiz street. 2 In the GCMA cars are, by far, the dominant mode of transport. On both surface streets and on the major corridors, the bulk of the vehicles are private cars, and the share of private cars is higher on the major corridors than on surface streets. Given The World Bank Group the dominance of the private car and taxis, it should come as no surprise that the GCMA is very congested. During peak periods, average speeds on sampled surface streets are between 6 to 25 kilometers per hour. Also during the peak periods, average speeds on the sampled major corridors, all of which are within the Ring Road, are between 20 to 45 kilometers per hour. FIGURE 1 MODAL SPLIT ON SURVEYED SURFACE STREETS WITHIN CAIRO Most speeds on corridors are in the range of 50 to 60 percent of free flow speeds, while on local streets they could reach 20 to 30 percent, meaning that many trips can take more than double the time. Lower speeds are particularly observed at the 15th of May bridge and Nasr Road, as well as on Ramses street. Worse, this congestion is not just during the morning and evening peak periods, but traffic conditions are congested for most of the day (see Figure 2). Small Truck 5% Big Bus 2% Heavy Truck 0.3% Micro-/ Mini-bus 14% Finally, in part because of the extreme congestion, road travel within the GCMA is a very unreliable affair; travel times between two points within the GCMA can vary a lot at different times of the day, sometimes by a factor of three. Taxis 24% Passenger Cars 55% FIGURE 2 CONGESTION DURING THE DAY ON THE MAJOR CORRIDORS Time of the day Congested Hours Corridor no. CAUSES OF CONGESTION IN GCMA Poor Traffic Management: This is probably the most important cause of congestion: limited parking capacity, few traffic signals, random stops by cars and minivans, no proper pedestrian crossings and U-turns are examples of poor traffic management in GCMA. Table 1 lists the main traffic management challenges in Cairo. It should be noted that the causes of congestion on the major corridors and the surface streets are different: On the major corridors the most important causes of congestion are vehicle breakdowns, security checks, and accidents; mostly observed on the May 3 Cairo Traffic Congestion Study I Executive Note 15th bridge and the Moneeb bridge. The most important causes of congestion on surface streets are Uturns at intersections, random stops of vehicles, and pedestrian crossings, and those were mostly observed on El Malek Faisal Street, Abbas Al Akkad Street, and Al Mokatam Street. TABLE 1: CAUSES OF CONGESTION IN THE GCMA – TRAFFIC MANAGEMENT PROBLEMS CATEGORY Design features of the road network SPECIFIC CAUSES • • • • Awareness of road etiquette and manners by various entities Parking supply and behavior • • • • • Law observance and enforcement Traffic influencing events • • • • Traffic management and control Traffic demand-related factors • • • • Physical bottlenecks U-turns Poor road surface quality Speed bumps No lane discipline Ubiquitous jaywalking Illegal stops by transit and other vehicles Limited parking capacity Illegal on-road parking Poor observance and enforcement of traffic laws and road occupancy policies (e.g., on-street vendors, animal-drawn carts). Road accidents Vehicle breakdowns VIP motorcades Poor control at intersections Lack of modern technologies for traffic management Special events Inflexible work hours Low transport prices and vehicle operating costs: owning and operating a car in Cairo is relatively cheap, creating little incentives for people to rationalize their travel or carpool. There are no on-street parking charges, no tolls on most major corridors, and gasoline and diesel are heavily subsidized in Egypt (up to 50%). In addition a large number of vehicles are outdated, making their purchase and operation cheaper. The relatively cheap cost of owning and operating a car in Cairo, especially when compared to similar large cities around the World (London, New York, Sao Paulo…) creates little or no incentive for people to rationalize their travel based on need, or to carpool. Public transport prices (metro as well as minibus, buses, taxis) are generally low and affordable, sometimes at the expense of the quality and reliability of the services (bus fares at 1 LE). The low operation cost of vehicles and the poor regulation and enforcement of transport services are partially contributing to the oversupply of taxis and minibuses. While sometimes compensating for the lack of mass transit supply, taxis and minibuses often compete aggressively on some major routes, further contributing to congestion. 4 The World Bank Group Inadequate supply of mass transit: There is only about 1,500 standard buses and 70 km of metro lines in Cairo. No Bus Rapid Transit (BRT) system currently exists, while the Heliopolis tram needs major upgrading and rehabilitation. For a large megacity, GCMA’s supply of transit and mass transit, be it large/standard busses, trams or metros is very limited especially when compared with comparable cities around the World (see Figures 3). It should be noted that there is strong demand for public transport in Cairo as observed with the high ridership on buses and metro, especially during peak hours (see Figure 4). However the required modal shift from private cars and taxis to mass transit is largely constrained by the limited supply of transit solutions. FIGURE 2: METRO AND BUS SUPPLY IN CAIRO AND OTHER MAJOR CITIES IN THE WORLD Km of Metro/million population 180 166 160 149 140 120 92 100 92 80 52 60 40 31 16 12 20 4 0 Mexico Moscow Sao city Paulo Paris London Tokyo Seoul New York Cairo Buses/million population (full sized buses) 1200 1020 1000 965 825 800 753 645 636 600 400 419 362 493 231 200 81 0 5 Cairo Traffic Congestion Study I Executive Note FIGURE 4: METRO RIDERSHIP AND DEMAND IN CAIRO AND OTHER MAJOR CITIES Ridership/Day/Kilometer of Metro Network (‘000) 40.00 36.92 35.00 30.08 30.00 25.00 20.47 20.00 15.00 10.00 5.00 21.85 15.73 14.50 24.17 18.26 11.41 10.00 6.62 8.36 7.11 3.45 1.53 0.00 III. The Current and Projected Economic Costs of Congestion in GCMA THE ECONOMIC COST OF CONGESTION Approximately 47 billion LE, or 8 billion USD, are wasted every year in the GCMA due to congestion; this is expected to increase to 105 billion LE by 2030 (Tables 3 and 4). With Egyptian’s GDP estimated at USD 229.5 billion in 2011, the economic costs of congestion in GCMA are estimated at about 3.6 percent of Egypt’s total GDP. The economic costs of congestion are distributed across a population of 19.6 million people living in the GCMA, resulting in a per capita cost of about LE 2,400 (USD 400). Assuming that the burden of this cost is primarily on the residents of GCMA, the estimated congestion cost per capita in Cairo is about 15 percent of their total GDP per capita, estimated at USD 2,700 in 2010 by the World Bank. These numbers are expected to continue to rise through 2030. Table 2 provides a description of the main cost components evaluated in this study. The single largest driver of costs is delay costs, which represents 31 percent of the total costs. If we add the costs associated with the lack of reliability, the extra time travelers need to build into their trip, to the costs of delay, the value of wasted time constitutes 50 percent of the costs of congestion in the GCMA. The health impact of congestion traffic’s emissions represents 19 percent of the total costs and is the second largest contributor to congestion costs. Another World Bank study1, that assessed in more details the overall health impacts of air 6 1. Air Pollution in Greater Cairo, the World Bank, 2013. The World Bank Group pollution in Greater Cairo, puts the costs associated to air pollution at about 0.8 to 1 percent of Egypt’s GDP, and identifies congestion as the main source of air pollution coming from transport. Wasted fuel is another contributor to costs (14 percent) both in terms of its cost to the government due to the subsidy and the direct cost to users. Agglomeration and business productivity losses that can be linked to congestion constitute 10 percent of costs. Suppressed demand and the impacts on demand for housing together constitute about 3 percent of total costs. Finally, congestion helps to improve the safety situation in the GCMA due to lower speeds and hence lower fatalities, slightly reducing the cost of road safety by 0.5 billion LE, a mere 1 percent from total. (see Figure ES.16). In comparison to other cities, New York loses about USD 10 billion/year2 on delays and wasted fuel alone, and Jakarta USD 5 billion/year3. Cairo’s losses at USD 8 billion/year are particularly significant given the relative importance of the city to Egypt’s overall economy: New York’s losses relative to the US GDP are negligible (0.07%) while Jakarta’s losses represent about 0.6% of Indonesia’s GDP; the relative cost of Cairo’s congestion to Egypt’s GDP therefore stands high at 3.6%, making it a national priority. TABLE 2: MAIN COST COMPONENTS EVALUATED IN THE STUDY COST COMPONENT DESCRIPTION Delays cost related to travelers’ time wasted in slow moving traffic. Reliability time wasted due to changed expectation regarding average travel time (for example, to reach an important meeting which requires 20 minutes average travel time, one travels 60 minutes before the meeting time to make sure he reaches that meeting on time). Fuel cost of excess fuel wasted when cars are not moving, or moving slowly due to congestion CO2 economic cost of carbon dioxide emissions and their effect on climate change Road Safety economic cost of accidents, including injuries and loss of life Other Emissions health cost from all vehicles’ emissions during traffic congestion. Vehicle Operating Cost (VOC) costs to vehicles, other than fuels, occurring during congestion (additional wear and tear on breaks, tires, lubricants…). Productivity economic cost of lost productivity of businesses and industries in Cairo due to traffic congestion Suppressed demand the economic cost of not making a trip to avoid traffic congestion 2. 2011 Urban Mobility Report, Texas Transportation Institute, 2011. 3. The Jakarta Post, 16 March, 2011, referring to a study by the Jakarta Transportation agency. 7 Cairo Traffic Congestion Study I Executive Note TABLE 3: SUMMARY OF THE ECONOMIC COSTS OF CONGESTION IN 2010 COST COMPONENT VALUE ANNUAL COST (MILLION USD) ANNUAL COST (BILLION LE) PERCENT OF TOTAL COST ANNUAL COST PER CAPITA (USD) Delay 2.2B hours 2,443 14.7 31% 125 Reliability 1.4B hours 1,526 9.2 19% 78 Fuel 1.9B liters 1,094 6.6 14% 56 CO2 7.1B kilograms 63 0.4 0.8% 3 Safety 0 fatalities; -3,100 injuries; 34,800 PDOs -92 -0.5 -1% -5 VOC N/A 371 2.2 4% 19 Other Emissions 44 million kilograms 1,478 8.8 19% 75 Agglomeration/ productivity N/A 875 5.2 10% 45 Suppressed Demand N/A 204 1.2 3% 10 Housing Demand N/A 10 0.1 0.2% 0.5 TOTAL N/A 7,972 47.7 100% 406 FIGURE 5: BREAKDOWN OF ECONOMIC COSTS IN 2010 (BILLION LE) 8 The World Bank Group TABLE 4: SUMMARY OF ECONOMIC COSTS OF CONGESTION IN 2030 COST COMPONENT VALUE ANNUAL COST (MILLION USD) ANNUAL COST (BILLION LE) PERCENT OF TOTAL COST ANNUAL COST PER CAPITA (USD) Delay 4.5B hours 5,435.0 32.6 31% 192 Reliability 2.9B hours 3,391.7 20.4 19% 120 Fuel 4.0B liters 2,431.7 14.6 14% 86 CO2 14.9B kilograms 141.7 0.9 0.8% 5 Safety 0 fatalities; -6,890 injuries; 78,570 PDOs -191.7 -1.1 -1% -7 VOC N/A 836.7 5.0 4% 30 Other Emissions 99.2 million kilograms 3,329.4 19.8 18% 117 Agglomeration/ Productivity N/A 1,677.4 10.0 11% 59 Suppressed Demand N/A 418.1 2.5 3% 15 Housing Demand N/A 10.7 0.1 0.2% 0.5 TOTAL N/A 17,480.7 104.7 100% 617 IV. Policy Options and Recommendations A comprehensive list of over 50 policy and investment measures was developed by reviewing best practices worldwide and gathering stakeholder input to assess those most relevant for Cairo. This list was combined with policy measures suggested by local experts. Some of the individual measures were assessed separately, others that are complimentary were sometimes combined in packages for analysis. The report includes a detailed discussion on the tested measures and their projected contribution (in numbers) to reducing congestion, Figure 6 presents a simplified visual illustration of findings, and compares some of the important measures. The larger the policy package and the closer to the upper right side of the graph it is, the better it is for quick and effective implementation. For example, the policy option to reduce the fuel subsidy can be technically implemented relatively quickly, at least gradually– with the exception of potential political difficulties – and has a large impact on reducing congestion costs, and it is a very cost effective way to address traffic congestion. By contrast, building new metro lines take a long time to implement, are relatively difficult to implement (because of managing the disruptions that will occur due to the construction works), are not as cost-effective as reducing the fuel subsidy given the high requirements for capital costs, but 9 Cairo Traffic Congestion Study I Executive Note they have a very large impact on reducing traffic congestion. Traffic management solutions (access management, non-motorised transport, corridor management), are measures that emerge as high priority and potential “quick wins.” Improving transit operations also performs well in the analysis. FIGURE 6: POLICY OPTIONS AND THEIR IMPACT ON CONGESTION REDUCTION IN GCMA Central Area Pricing Traveler Information Systems New Project TDM Reduce Fuel Subsidies Cost Effectiveness Ratio Access Management Metro Expansion – System Buildout Transit Operations / BRT Advanced Corridor Management New Highway Highway Widening Non-Motorized Transport Metro Expansion – Circle Line Nile River Ferry Implementation Feasibility Small Impact Large Impact Near – Mid - Long 10 Worksite TDM The World Bank Group Recommendations While Cairo congestion has a large number of complex problems, there are four categories of actions that can yield significant results in tackling congestion if properly implemented. 1. START WITH TRAFFIC MANAGEMENT SOLUTIONS – IMPLEMENT CORRIDOR MANAGEMENT SCHEMES. This recommendation includes measures aimed at maximizing the utilization of the available road space in Cairo. Corridor management schemes involve the selection of pilot roads and corridors and implementing actions to improve traffic flow: introducing traffic signals at intersections, removing or regulating U-Turns, improving pedestrian access on sidewalks and crossings, providing and enforcing stops for buses and minivans, and introducing onstreet parking where possible. The study has already identified some corridors suffering high congestion, which can be considered for pilot improvements such as the May 15th bridge, Al Mokatam Street and El Malek Faisal Street. In addition, the study has already identified the type and location for each traffic influencing event along surveyed streets and corridors, therefore facilitating implementation (see technical report), although additional detailed technical studies would be required for implementation. 2. SOMEBODY HAS TO BE IN CHARGE, NOT EVERYBODY - STRENGTHEN THE CAPACITY AND AUTHORITY OF THE GREATER CAIRO TRANSPORT REGULATORY AUTHORITY. The recent creation of the GCTRA was a move in the right direction. Tackling congestion, especially in a complex environment such as in Cairo, involves too many stakeholders. While coordination is important, it is not enough to drive policies and interventions. In order to ensure that proper and effective actions are undertaken, one agency should take the overall responsibility. It has to be endowed with sufficient capacity, resources, and authority. Most importantly, it needs strong political backing from the highest levels in order to overcome the various challenges associated with its desired role in managing traffic in Cairo. 3. THERE IS PRICE FOR USING THE RARE PUBLIC SPACE, WHICH NEEDS TO BE SHARED – INTRODUCE TRAFFIC RELATED CHARGES. Revising pricing has multiple advantages: • • • It is an effective demand management instrument as it rationalizes travel; It generates much needed resources to improve traffic in sustainable manner; and Very importantly, it creates an understanding and culture that road space is not free and has to be shared or paid for its usage (such as through parking charges). Therefore, the following actions are recommended: 11 Cairo Traffic Congestion Study • • • 4. I Executive Note Start with introducing on-street parking charges (this could be operated by the private sector). Experience around the World suggests this is the traffic related charge that is most accepted by the public. It also creates an important behavioral change and understanding that there is a cost for using public space and that it needs to be shared. On-street parking charges can be the first action part of a broader parking policy that will see an increase of parking requirements for new commercial and residential centers, and the possible development of parking structures in Cairo. Implement gradual removal of gasoline and fuel subsidy. This money should be re-invested in improving traffic, notably in mass transit. If communicated effectively to the public that savings from reduced subsidies are used to improve traffic, there will be broader acceptance and support. Review the tariff structure of all transport modes to improve bus and microbus quality of service and to organize their operations. This is a challenging task to implement, requiring political will and consultations with private operators. However it requires little cost and if tackled properly could significantly reduce congestion. The Cairo Governorate and the Greater Cairo Transport Regulatory Authority should at best try and regulate the competition on routes and at least organize the stopping areas for buses and microbuses. This action will require the use of both enforcement as well as financial incentives (cash subsidy to operators instead of fuel, microbus scarping scheme such as implemented for taxis…). INVEST, INVEST, INVEST, BUT NOT IN URBAN ROADS! – EXPAND YOUR MASS TRANSIT NETWORK. Figures 3 and 4 make it very clear that there is little public transport in Cairo, despite being highly demanded. While all previous actions are very important, and will yield high results in the short to medium term, a city of the size of Cairo just can’t properly function without a reliable mass transit network. Building more roads4 and bridges will simply not solve the problem: Los Angeles tried building roads only, so did Houston and Riyadh, and now they are all building public transport. Expanding the metro is one of the options (completing lines 3, 4…), but is not the only one, and there are also other cost effective systems as such as BRT (possibly on the ring road?) and trams (the upgrading the Heliopolis Tram). The better integration of transit systems (bus and metro for example), such as through single fare ticketing, will also improve transport services. Fiscal constraints might be an impediment for investments, however action 2 above is meant to generate some important resources for mass transit investments (especially from subsidy removal). Private sector participation could contribute to some of the costs (such as operations and rolling stock for trams and BRT). After all, and as the numbers in this study demonstrate, there are very large economic benefits from reducing congestion in Cairo, justifying several investments. It should be noted however that sine the economic benefits in this study are rather of order of magnitude, any proposed project or investment has to undergo a proper and detailed economic and cost/benefit analysis. 12 4. With the exception of the ring road which would contribute in alleviating congestion
