TR FY 2014 Statistical Digest
advertisement
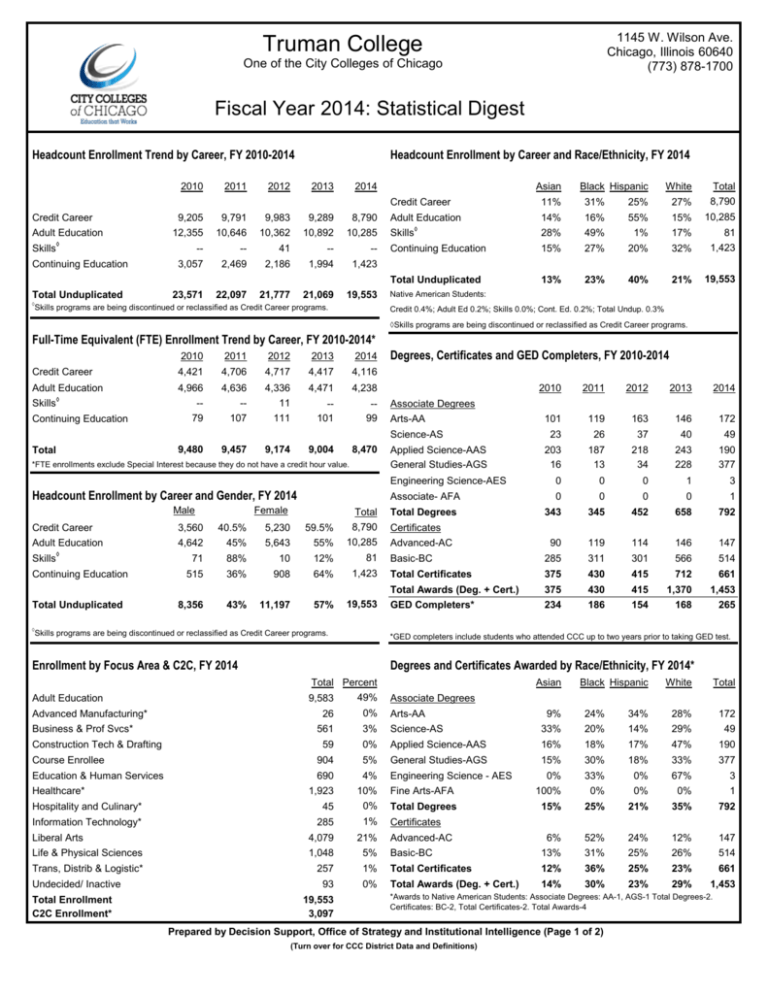
1145 W. Wilson Ave. Chicago, Illinois 60640 (773) 878-1700 Truman College One of the City Colleges of Chicago Fiscal Year 2014: Statistical Digest Headcount Enrollment Trend by Career, FY 2010-2014 2010 Credit Career Adult Education 9,205 2011 9,791 2012 Headcount Enrollment by Career and Race/Ethnicity, FY 2014 2013 9,983 2014 9,289 8,790 12,355 10,646 10,362 10,892 10,285 -- -- 41 -- -- Continuing Education 3,057 2,469 2,186 1,994 1,423 Total Unduplicated 23,571 22,097 21,777 21,069 19,553 Skills◊ ◊ Skills programs are being discontinued or reclassified as Credit Career programs. 2010 2011 2012 2013 2014 Credit Career 4,421 4,706 4,717 4,417 4,116 Adult Education 4,966 -- 4,636 -- 4,336 11 4,471 4,238 79 107 111 -101 -99 Continuing Education Asian 11% 31% 25% 27% Total 8,790 Adult Education 14% 16% 55% 15% 10,285 Skills ◊ 9,480 9,457 9,174 9,004 8,470 *FTE enrollments exclude Special Interest because they do not have a credit hour value. Headcount Enrollment by Career and Gender, FY 2014 Male Female Credit Career 3,560 40.5% 5,230 59.5% Total 8,790 Adult Education 4,642 45% 5,643 55% 10,285 Skills◊ Continuing Education Total Unduplicated ◊ White 28% 49% 1% 17% Continuing Education 15% 27% 20% 32% 81 1,423 Total Unduplicated 13% 23% 40% 21% 19,553 Native American Students: ◊Skills programs are being discontinued or reclassified as Credit Career programs. Degrees, Certificates and GED Completers, FY 2010-2014 2010 2011 2012 2013 2014 101 119 163 146 172 23 26 37 40 49 203 16 187 13 218 34 243 228 190 377 Engineering Science-AES 0 0 0 1 3 Associate- AFA 0 0 0 0 1 343 345 452 658 792 90 119 114 146 147 Basic-BC 285 311 301 566 514 Total Certificates 375 430 415 712 661 Total Awards (Deg. + Cert.) 375 430 415 1,370 1,453 GED Completers* 234 186 154 168 265 Associate Degrees Arts-AA Science-AS Total Black Hispanic Credit 0.4%; Adult Ed 0.2%; Skills 0.0%; Cont. Ed. 0.2%; Total Undup. 0.3% Full-Time Equivalent (FTE) Enrollment Trend by Career, FY 2010-2014* Skills◊ Credit Career 71 88% 10 12% 81 515 36% 908 64% 1,423 8,356 43% 11,197 57% 19,553 Applied Science-AAS General Studies-AGS Total Degrees Advanced-AC Certificates Skills programs are being discontinued or reclassified as Credit Career programs. *GED completers include students who attended CCC up to two years prior to taking GED test. Enrollment by Focus Area & C2C, FY 2014 Degrees and Certificates Awarded by Race/Ethnicity, FY 2014* Adult Education Advanced Manufacturing* Business & Prof Svcs* Construction Tech & Drafting Total Percent 49% 9,583 26 0% Asian Arts-AA Total 9% 24% 34% 28% 172 3% Science-AS 33% 20% 14% 29% 49 59 0% Applied Science-AAS 16% 18% 17% 47% 190 15% 30% 18% 33% 377 0% 33% 0% 67% 3 Fine Arts-AFA 100% 0% 0% 0% 1 Total Degrees 15% 25% 21% 35% 792 Course Enrollee 904 5% General Studies-AGS 690 4% Engineering Science - AES 1,923 10% 0% Hospitality and Culinary* White 561 Education & Human Services Healthcare* Black Hispanic Associate Degrees 45 285 1% Liberal Arts 4,079 21% Life & Physical Sciences 1,048 5% Trans, Distrib & Logistic* 257 1% Total Certificates 12% 36% 25% 23% 661 93 0% Total Awards (Deg. + Cert.) 14% 30% 23% 29% 1,453 Information Technology* Undecided/ Inactive Total Enrollment C2C Enrollment* 19,553 3,097 Certificates Advanced-AC Basic-BC 6% 52% 24% 12% 147 13% 31% 25% 26% 514 *Awards to Native American Students: Associate Degrees: AA-1, AGS-1 Total Degrees-2. Certificates: BC-2, Total Certificates-2. Total Awards-4 Prepared by Decision Support, Office of Strategy and Institutional Intelligence (Page 1 of 2) (Turn over for CCC District Data and Definitions) City Colleges of Chicago Daley College Harold Washington College Kennedy-King College Malcolm X College Olive-Harvey College Truman College Wright College Community College District No. 508 226 W. Jackson Blvd., Chicago, IL 60606 (312) 553-2500 Fiscal Year 2014: Statistical Digest Headcount Enrollment Trend by Career, FY 2010-2014 Degrees, Certificates and GED Completers, FY 2010-2014 2011 62,083 2012 63,055 2013 62,391 2014 62,100 Associate Degrees 2010 2011 2012 2013 2014 Credit Career 2010 59,689 Arts-AA 1,073 1,096 1,360 1,410 1,520 Adult Education 43,332 35,978 34,836 36,642 33,973 Science-AS 131 163 175 213 252 2,599 1,677 1,805 1,890 2,186 Applied Science-AAS 1,055 937 1,263 1,228 1,095 30,034 26,674 22,916 18,508 15,837 General Studies-AGS 150 246 517 897 1,417 12 13 8 25 27 0 2,421 4 2,459 1 3,324 5 3,778 11 4,322 ◊ Skills Continuing Education Total (Unduplicated) 127,517 119,449 116,765 114,255 109,358 Engineering Science-AES Fine Arts-AFA Total Degrees ◊ Most Skills programs are being discontinued or reclassified as Credit Career programs. Full-Time Equivalent (FTE) Enrollment Trend by Career, FY 2010-2014* Certificates 2011 31,125 2012 31,302 2013 31,044 2014 30,690 615 697 744 848 966 Credit Career 2010 29,636 Basic-BC 5,671 5,401 5,621 5,391 6,603 Adult Education 16,919 15,048 13,689 14,476 13,461 Total Certificates 6,286 6,098 6,365 6,239 7,569 681 444 492 499 542 Total Awards (Deg. + Cert.) 8,707 8,557 9,689 10,017 11,891 GED Completers* 1,237 978 801 966 1,350 ◊ Skills Continuing Education Total 537 636 659 569 567 47,774 47,254 46,143 46,589 45,261 Advanced-AC *GED completers include students who attended CCC up to two years prior to taking GED test. *FTE enrollments exclude Special Interest courses because they do not have a credit hour value. Degrees and Certificates Awarded by Race/Ethnicity, FY 2014* Headcount Enrollment by Career and Race/Ethnicity, FY 2014 Associate Degrees White Asian 4% Black Hispanic 36% 41% White Total 17% 1,520 Credit Career 6% 43% 31% 17% 17% 21% 35% 24% 252 Adult Education 5% 29% 57% 9% 33,973 Applied Science-AAS 8% 46% 22% 22% 1,095 General Studies-AGS 11% 39% 23% 24% 1,417 Engineering Science-AES 11% 11% 26% 37% 27 Fine Arts-AFA 9% 27% 27% 36% 11 Native American Students - Credit: 0.4%; Adult Ed.: 0.2%; Skills: 0.4%; Continuing Ed.: 0.3%; Total Undup. 0.3% Total Degrees Certificates 8% 39% 30% 21% 4,322 Headcount Enrollment by Career and Gender, FY 2014 Advanced-AC 4% 40% 28% 24% 966 15% 36% 17% 26% 6,603 ◊ Black Hispanic Arts-AA Total 62,100 Asian Skills 31% 34% 7% 20% 2,186 Continuing Education 10% 26% 27% 27% 15,837 Total (Unduplicated) 7% 36% 38% 16% 109,358 Male Female Total Science-AS Basic-BC Credit Career 24,560 40% 37,540 61% 62,100 Total Certificates 13% 37% 18% 26% 7,569 Adult Education 14,298 42% 19,675 58% 33,973 Total Awards (Deg. + Cert.) 12% 37% 22% 24% 11,891 Skills◊ 2,025 93% 161 7% 2,186 Continuing Education 8,054 51% 7,783 49% 15,837 Total (Unduplicated) 46,373 42% 62,985 58% 109,358 Total Percent 32,440 30% 496 0% 5,329 1,697 5% 2% 12,352 11% 6,328 6% 12,488 11% 1,061 1,697 1% 2% 24,736 23% Life & Physical Sciences 5,591 5% Trans, Distrib & Logistic* 4,404 4% 739 109,358 1% Advanced Manufacturing* Business & Prof Svcs* Construction Tech & Drafting Course Enrollee Education & Human Services Healthcare* Hospitality and Culinary* Information Technology* Liberal Arts Undecided/ Inactive Total Enrollment C2C Enrollment* CCC ENROLLMENT DEFINITIONS Fiscal Year 2014: includes the Summer 2013, Fall 2013, and Spring 2014 semesters. Enrollment by Focus Area & C2C, FY 2014 Adult Education *Awards to Native American Students: Associate Degrees: AA-5, AS-1, AAS-2 AGS-6, Total Degrees- 14. Certificates: AC-2, BC-28. Total Certificates- 30. Unduplicated Enrollment: students are counted only once despite enrollment in multiple instructional areas or colleges. FTE (Full-time Equivalent Enrollment): is the calculation of the total number of student credit hours divided by 30, as defined by the Illinois Community College Board. CCC CAREER DEFINITIONS Credit Career: includes courses leading to an associate degree, general education courses that transfer to a four-year institution, courses preparing students for college-level instruction (developmental courses), and occupational courses leading to workforce development degrees or certificates. Credit enrollees include both degree-seeking and non-degree seeking students. Continuing Education Career: includes courses offered for short-term workforce training and non-credit courses for personal growth that do not count toward an associate degree or transfer to a four-year college or university. Adult Education Career: includes courses in Adult Basic Education (ABE), English-as-a-Second Language (ESL), and preparation for the GED examination. Skills Career: includes courses that provide hands-on training in technical programs leading to employment. Most Skills programs are being discontinued or reclassified as Credit programs. 25,475 Prepared by Decision Support, Office of Strategy and Institutional Intelligence (Page 2 of 2) (Turn over for College Data)
