PSYC 230 Assignment (Psychophysical Methods) Name: R#: Bac
advertisement
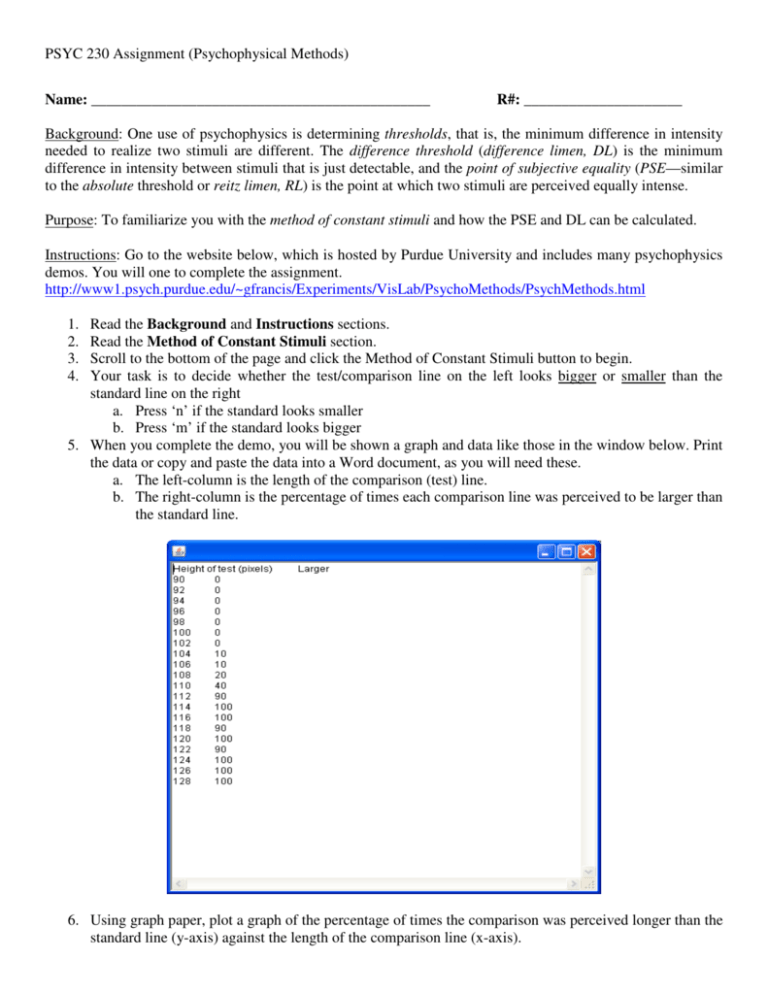
PSYC 230 Assignment (Psychophysical Methods) Name: _____________________________________________ R#: _____________________ Background: One use of psychophysics is determining thresholds, that is, the minimum difference in intensity needed to realize two stimuli are different. The difference threshold (difference limen, DL) is the minimum difference in intensity between stimuli that is just detectable, and the point of subjective equality (PSE—similar to the absolute threshold or reitz limen, RL) is the point at which two stimuli are perceived equally intense. Purpose: To familiarize you with the method of constant stimuli and how the PSE and DL can be calculated. Instructions: Go to the website below, which is hosted by Purdue University and includes many psychophysics demos. You will one to complete the assignment. http://www1.psych.purdue.edu/~gfrancis/Experiments/VisLab/PsychoMethods/PsychMethods.html Read the Background and Instructions sections. Read the Method of Constant Stimuli section. Scroll to the bottom of the page and click the Method of Constant Stimuli button to begin. Your task is to decide whether the test/comparison line on the left looks bigger or smaller than the standard line on the right a. Press ‘n’ if the standard looks smaller b. Press ‘m’ if the standard looks bigger 5. When you complete the demo, you will be shown a graph and data like those in the window below. Print the data or copy and paste the data into a Word document, as you will need these. a. The left-column is the length of the comparison (test) line. b. The right-column is the percentage of times each comparison line was perceived to be larger than the standard line. 1. 2. 3. 4. 6. Using graph paper, plot a graph of the percentage of times the comparison was perceived longer than the standard line (y-axis) against the length of the comparison line (x-axis). PSYC 230 Assignment (Psychophysical Methods) 7. Data Analysis: You will calculate your point of subjective equality (PSE) and difference threshold or constant error (CE). The PSE can estimated through linear interpolation: ܲܵ= ܧ ሺݔଶ − ݔଵ ሻሺݕଶ − ݕଵ ሻ + ݕଵ ሺݔଷ − ݔଵ ሻ The xs are proportions around .50 (50%) and the ys are the lengths of the lines (in pixels) from the data. Basically, you’re calculating the point along the x-axis that corresponds to 50% on the y-axis. (If you are unfamiliar with interpolation, just ask.) Here’s the PSE from my data on the preceding page: ܲܵ= ܧ ሺ. 50 − .40ሻሺ112 − 110ሻ ሺ. 10ሻሺ2ሻ + 110 = + 110 = .4 + 110 = 110.40 ሺ. 90 − .40ሻ ሺ. 50ሻ The difference threshold/constant error is the difference between the PSE and the length of the standard line (100 pixels). ܧܵܲ = ܧܥ− ܵ = ݐ110.40 − 100 = 10.40 8. What to turn in: • • • • Printout of the data generated from the demo. Graph from Step 6. Calculation of the PSE and CE, written neatly on the graph, Answer to the following question: What does your value for the constant mean?
