Tutorial
Name ____________________________________________________________ Tutorial
Potential Energy Diagrams
I. Introduction
The objective of this tutorial is to familiarize you with constructing the potential energy diagrams for simple mechanical systems. We shall ignore friction and assume that energy is conserved.
II. The Square Well Potential
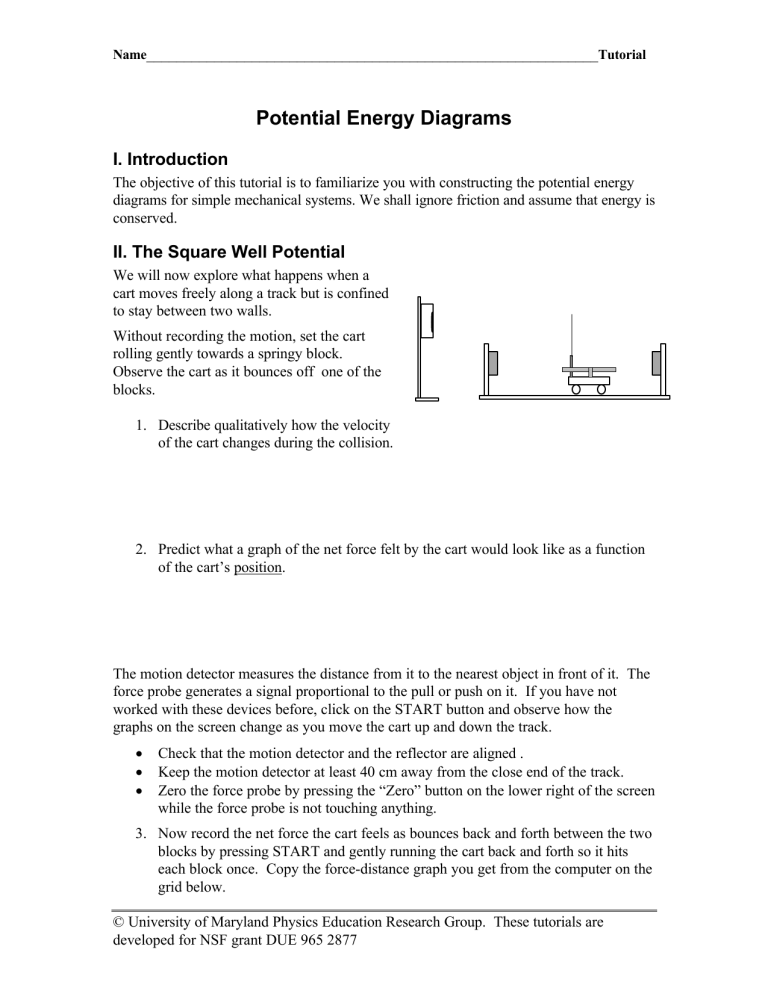
We will now explore what happens when a cart moves freely along a track but is confined to stay between two walls.
Without recording the motion, set the cart rolling gently towards a springy block.
Observe the cart as it bounces off one of the blocks.
1. Describe qualitatively how the velocity of the cart changes during the collision.
2. Predict what a graph of the net force felt by the cart would look like as a function of the cart’s position.
The motion detector measures the distance from it to the nearest object in front of it. The force probe generates a signal proportional to the pull or push on it. If you have not worked with these devices before, click on the START button and observe how the graphs on the screen change as you move the cart up and down the track.
•
Check that the motion detector and the reflector are aligned .
•
Keep the motion detector at least 40 cm away from the close end of the track.
•
Zero the force probe by pressing the “Zero” button on the lower right of the screen while the force probe is not touching anything.
3. Now record the net force the cart feels as bounces back and forth between the two blocks by pressing START and gently running the cart back and forth so it hits each block once. Copy the force-distance graph you get from the computer on the grid below.
© University of Maryland Physics Education Research Group. These tutorials are developed for NSF grant DUE 965 2877
Net
Force
Potential Energy Diagrams
Distance from end block
Compare with your prediction. Are there any discrepancies?
4. The potential energy, U(x), is given by an integral from a reference point (taken here to x = 0)
= − x r
F dr r
= −
0
∫ ∫
x
0 where the right hand integral is for the one-dimensional case.
Use your F vs. x graph to predict the qualitative shape of the potential energy vs. x graph for the cart. Explain how you arrived at your answer.
PE
Distance from end block
2
Potential Energy Diagrams
III. Motion of a body held by springs
In the following experiments, we will use the computer and the given sensors to record the motion of the cart, measuring simultaneously its position and the force it experiences when connected to two springs. To set up the experiment:
• connect the springs to the force probe mounted on the cart.
1. Draw the free body diagram for the cart at the following positions:
(a) center of the track (b) displaced to the left (c) displaced to the right
2. Without recording the motion on the computer, displace the cart by about 20 cm and release it. Describe the net force that acts on the cart as it oscillates.
3. What are the positions at which the cart experiences the maximum and the minimum net force?
4. Predict how the net force changes as the cart is displaced by a distance x from the equilibrium position. Plot your prediction on the graph at right.
Net Force x
3
Potential Energy Diagrams
Let’s now rearrange the display to choose the zero of position at the cart’s equilibrium point, rather than at the ranger itself. To do this, we have to introduce a new variable into the program and define it. Do this by following the steps below.
a.
Set the cart to be at rest at equilibrium position between the springs, and click
START to record the position of the cart. Write down the number: x
0
= b.
Click and hold the right button. Select DATA and choose DATA A->DATA B.
c.
Displace the cart by approximately 10 cm from the equilibrium position and release it so that it begins to oscillate.
d.
Click on START in the distance-time window to begin data logging.
e.
When done, select DATA and NEW COLUMN. In the calculator pad that comes up, for the FORMULA, type “Dist”
−
your value of x
0
. Fill in the FULL NAME with Displacement , SHORT NAME x , UNITS m and click OK .
f.
In the upper left graph, go to the y-axis label. Clicking with the left mouse button brings up the list of quantities that may be graphed. Select Displacement instead of Distance . Discuss the differences between Displacement and Distance . Repeat the substitution in the force-distance and velocity-distance graphs.
5. Does the force-displacement data match your predictions? Resolve any discrepancies.
6. Suppose the cart is oscillating. Write an expression to describe the work done by the net force F as the cart moves from an arbitrary displacement d
1
to another, d
2
.
7. How is the change in kinetic energy of the cart related to the work done on the cart?
4
Potential Energy Diagrams
8. How is the change in potential energy of the cart related to the work done on the cart? Explain.
9. Copy the force-displacement graph from the computer on the grid below.
Net Force disp.
10. Use your force-displacement graph to sketch what you think the potential energy vs. displacement graph would look like. Explain how you determined the shape of this graph.
PE disp
We can now use the computer to construct kinetic and potential energy curves from our data.
On the computer, select DATA and NEW COLUMN. In the calculator pad that comes up, for the FORMULA, type 0.5*“Vel”^2. This is the expression for the kinetic energy of the cart. (The mass of the cart is 1 kg.) View the kinetic energy vs. displacement in the bottom right graph on the computer.
5
Potential Energy Diagrams
11. Sketch a copy of the kinetic energy graph from the computer in the space below.
12. Sketch what the total energy minus the kinetic energy looks like as a function of displacement. Does this agree with your prediction for the potential energy graph?
Resolve any discrepancies.
6
