Actavis has to wait longer to claim top-three ranking
advertisement
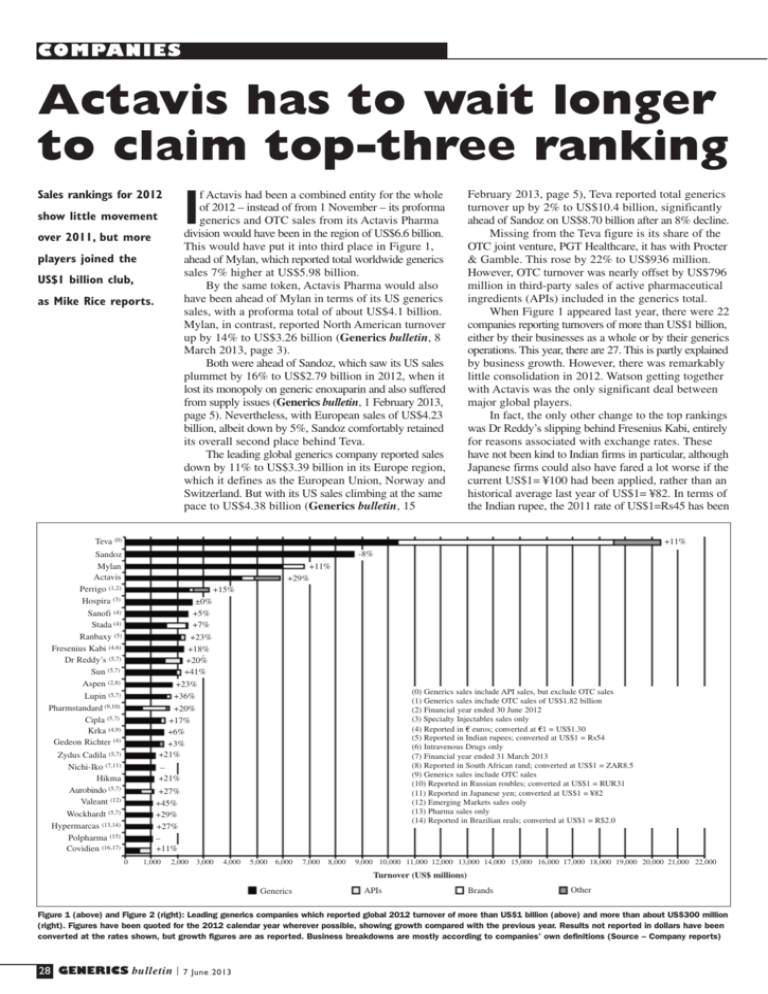
COMPANIES Actavis has to wait longer to claim top-three ranking I Sales rankings for 2012 f Actavis had been a combined entity for the whole of 2012 – instead of from 1 November – its proforma generics and OTC sales from its Actavis Pharma division would have been in the region of US$6.6 billion. This would have put it into third place in Figure 1, ahead of Mylan, which reported total worldwide generics sales 7% higher at US$5.98 billion. By the same token, Actavis Pharma would also have been ahead of Mylan in terms of its US generics sales, with a proforma total of about US$4.1 billion. Mylan, in contrast, reported North American turnover up by 14% to US$3.26 billion (Generics bulletin, 8 March 2013, page 3). Both were ahead of Sandoz, which saw its US sales plummet by 16% to US$2.79 billion in 2012, when it lost its monopoly on generic enoxaparin and also suffered from supply issues (Generics bulletin, 1 February 2013, page 5). Nevertheless, with European sales of US$4.23 billion, albeit down by 5%, Sandoz comfortably retained its overall second place behind Teva. The leading global generics company reported sales down by 11% to US$3.39 billion in its Europe region, which it defines as the European Union, Norway and Switzerland. But with its US sales climbing at the same pace to US$4.38 billion (Generics bulletin, 15 show little movement over 2011, but more players joined the US$1 billion club, as Mike Rice reports. February 2013, page 5), Teva reported total generics turnover up by 2% to US$10.4 billion, significantly ahead of Sandoz on US$8.70 billion after an 8% decline. Missing from the Teva figure is its share of the OTC joint venture, PGT Healthcare, it has with Procter & Gamble. This rose by 22% to US$936 million. However, OTC turnover was nearly offset by US$796 million in third-party sales of active pharmaceutical ingredients (APIs) included in the generics total. When Figure 1 appeared last year, there were 22 companies reporting turnovers of more than US$1 billion, either by their businesses as a whole or by their generics operations. This year, there are 27. This is partly explained by business growth. However, there was remarkably little consolidation in 2012. Watson getting together with Actavis was the only significant deal between major global players. In fact, the only other change to the top rankings was Dr Reddy’s slipping behind Fresenius Kabi, entirely for reasons associated with exchange rates. These have not been kind to Indian firms in particular, although Japanese firms could also have fared a lot worse if the current US$1= ¥100 had been applied, rather than an historical average last year of US$1= ¥82. In terms of the Indian rupee, the 2011 rate of US$1=Rs45 has been Teva (0) +11% -8% Sandoz Mylan Actavis Perrigo (1,2) Hospira (3) +11% +29% +15% ±0% +5% +7% +23% +18% +20% +41% +23% +36% +20% +17% +6% +3% +21% Sanofi (4) Stada (4) Ranbaxy (5) Fresenius Kabi (4,6) Dr Reddy’s (5,7) Sun (5,7) Aspen (2,8) Lupin (5,7) Pharmstandard (9,10) Cipla (5,7) Krka (4,9) Gedeon Richter (4) Zydus Cadila (5,7) Nichi-Iko (7,11) Hikma Aurobindo (5,7) Valeant (12) (0) Generics sales include API sales, but exclude OTC sales (1) Generics sales include OTC sales of US$1.82 billion (2) Financial year ended 30 June 2012 (3) Specialty Injectables sales only (4) Reported in C euros; converted at C1 = US$1.30 (5) Reported in Indian rupees; converted at US$1 = Rs54 (6) Intravenous Drugs only (7) Financial year ended 31 March 2013 (8) Reported in South African rand; converted at US$1 = ZAR8.5 (9) Generics sales include OTC sales (10) Reported in Russian roubles; converted at US$1 = RUR31 (11) Reported in Japanese yen; converted at US$1 = ¥82 (12) Emerging Markets sales only (13) Pharma sales only (14) Reported in Brazilian reals; converted at US$1 = R$2.0 – +21% +27% +45% +29% +27% – +11% Wockhardt (5,7) Hypermarcas (13,14) Polpharma (15) Covidien (16,17) 0 1,000 2,000 3,000 4,000 5,000 6,000 7,000 8,000 9,000 10,000 11,000 12,000 13,000 14,000 15,000 16,000 17,000 18,000 19,000 20,000 21,000 22,000 Turnover (US$ millions) Generics APIs Brands Other Figure 1 (above) and Figure 2 (right): Leading generics companies which reported global 2012 turnover of more than US$1 billion (above) and more than about US$300 million (right). Figures have been quoted for the 2012 calendar year wherever possible, showing growth compared with the previous year. Results not reported in dollars have been converted at the rates shown, but growth figures are as reported. Business breakdowns are mostly according to companies’ own definitions (Source – Company reports) 28 GENERICS bulletin 7 June 2013 COMPANIES Morocco and Elie/Savanna in Sudan. The first full year of the MSI deal increased the firm’s injectables sales by nearly half to almost US$500 million. With its Branded business segment in the Middle East and North Africa region reporting sales up by nearly a fifth to over US$500 million, Hikma reported a 21% turnover rise to US$1.11 billion in 2012. Later this month, on 28 June, Mallinckrodt will be spun off from parent group Covidien to operate as a standalone business. Generics and APIs will make up just under half of Mallinckrodt’s US$2 billion turnover, with medical-imaging products accounting for the other half. Branded pharmaceuticals with 8% of turnover will make up the difference. In the year ended 28 September 2012, generics sales by Covidien’s Specialty Pharma unit increased by 16% to US$573 million, while its API business rose by 4% to US$433 million. Two Indian firms have had their rankings affected by divestments. Orchid has dropped out of Figure 2 completely, having sold its injectable antibiotics business to Hospira for US$380 million in 2010, and agreed with the same firm last year to part with its API development and production centre in Aurangabad for about US$200 million. Strides Arcolab, meanwhile, has fallen as a result of selling its Australian Ascent business to Actavis in 2012 (Generics bulletin, 3 February 2012, page 1), and will drop even further when it offloads its Agila Specialties injectables operation to Mylan for up to US$1.85 billion (Generics bulletin, 8 March 2013, page 1). Last year, Agila contributed about US$250 million to the firm’s turnover, while the rump Pharma solid-dose division had sales of about US$170 million. G replaced by US$1=Rs54, an effective devaluation of 20%. An addition to the rankings this year is Polpharma. This private company has always been absent as it has produced no publicly-available sales data. A company presentation, however, claimed a 2012 sales figure of US$1.02 billion. Similarly, Pharmascience and Synthon are in Figure 2 on the basis of their own figures. Notable absentees from the listings are the private Canadian firm Apotex, which has simply claimed for many years annual sales of over US$1 billion; the US firm Par, which went private last year when it was bought by private-equity firm TPG for US$1.9 billion (Generics bulletin, 19 October 2012, page 2); and the generics sales of Pfizer, including those of its Greenstone US generics unit. According to Pfizer, its Established Products division increased its turnover by 11% to US$10.2 billion in 2012. However, this figure included 12 months of Lipitor (atorvastatin) sales in the US and Japan. The Established Products total excluded around US$4.5 billion from sales of off-patent products that fell under Pfizer’s Emerging Markets division. Japanese companies are gradually moving up the rankings, with Nichi-Iko appearing in Figure 1 for the first time, and Sawai rising to the top of Figure 2. The former has a generics joint venture with Sanofi that was set up in 2010 (Generics bulletin, 18 June 2010, page 7). Separately, Sanofi reported generics sales up by 14% to C1.84 billion in 2012. Other newcomers to Figure 1 include Jordan’s Hikma and Covidien of the US. Hikma had to thank its acquisition of Baxter’s Multi-Source Injectables (MSI) business in the US midway through 2011, as well as the more recent additions of Promopharm in There was remarkably little consolidation among the top global players in 2012 Sawai (7,11) +19% EMS (14) +10% Glenmark (5,7) +25% Aché (14) +14% Pharmascience (15) – Towa (7,11) +13% Endo (18) +12% +3% Egis (19,20) Torrent (5,7) +19% Impax +13% CFR Pharma +16% Adcock Ingram (8,20,21) +3% Ipca Labs (5,7) +19% Jubilant (5,7,13) +22% Intas (5,22) (15) Company presentation (16) Specialty Pharma and API sales only (17) Financial year ended 28 September 2012 (18) Qualitest generics sales only (19) Reported in Hungarian forints; converted at US$1 = HuF220 (20) Financial year ended 30 September 2012 (21) Brand sales are for domestic OTC business (22) Financial year ended 31 March 2012 (23) Specialty Products sales only (24) Reported in Bulgarian lev; converted at US$1 = BGN1.50 (25) Reported in Chinese yuan; converted at US$1 = CNY6.20 +36% Orion (4,23) +14% Biocon (5,7) +18% Sopharma (24) +7% Strides Arcolab (5) +31% Chemiphar (7,11) +12% Synthon (15) – Simcere (25) +2% Acino (4) +91% 0 100 200 300 Generics 400 500 600 Turnover (US$ millions) APIs Brands 700 800 900 1,000 1,100 Other 7 June 2013 GENERICS bulletin 29
