TECHNO SHARES & STOCKS LTD
INDIA RESEARCH
FMCG
ACCUMULATE
23rd March 2009
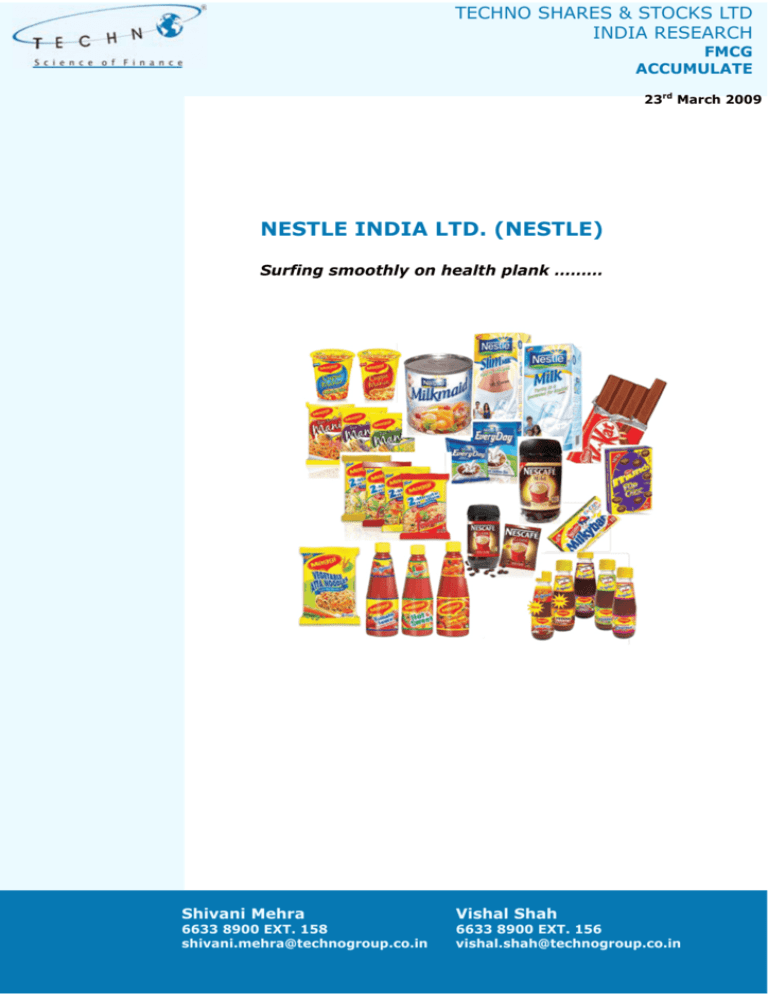
NESTLE INDIA LTD. (NESTLE)
Surfing smoothly on health plank ………
Shivani Mehra
6633 8900 EXT. 158
shivani.mehra@technogroup.co.in
Vishal Shah
6633 8900 EXT. 156
vishal.shah@technogroup.co.in
INTIATING COVERAGE:
NESTLE INDIA LTD. (NESTLE)
ACCUMULATE
Date
23rd March 2009
CMP
INR 1,520
52 week High / Low
INR 1,880 / 1,220
Equity Cap (current)
INR 96.42cr
Face Value
INR 10
Nestle India is well know for its brands like Maggie in the food
segment, Cerelac in the infant foods segment & Milkmaid in the
condensed milk space. With strong support from its parent Nestle
S.A., Nestle India has created a niche through its product offerings
in India. The strong brand equity has enabled it to attain leadership
position in the respective categories. The emergence of urban and
semi-urban areas on the Indian landscape spells a secular long term
positive for the pro-urban product portfolio built & nurtured by
Nestle for last many decades.
Mkt. Capitalization
INR 14,658.25 cr
KEY RATIONALE
Avg. Daily Vol. (12 M)
34,743
BSE SENSEX
8,966.68
NSE - NIFTY
2,807.05
Bloomberg Code
NEST IN
Build-up of niche product portfolio with focus on health &
nutrition: The build up of the product portfolio & brand
extension based on the health & nutrition platform aptly places
Nestle to capitalize on the growing wellness trend. The Maggi
rice noodles, probiotic dahi, Cerevita protein & fruit cereal, low
fat milk reflects Nestle’s ideology to create health & wellness
products.
BSE Code
500790
Prepared cooking dishes (PCD) & confectionaries leading
the growth: The convenience foods & chocolates have grown at
2 year CAGR of 22.4% & 16.7% respectively. The PCD &
chocolates have registered strong YOY volume growth of 2728% & 19-20% resp. even during testing times in CY08.
SHAREHOLDING PATTERN @ 31-12-08
Promoters
61.9%
FII & DFI
19.7%
Public & Others
18.4%
The introduction of nutritional variants and availability at
attractive price points has enhanced penetration & spurred the
convenience foods & confectionary segment growth.
3-MTS
6-MTS
1-YR
NESTLE
12%
-9%
8%
Nifty
-9%
-31%
-38%
Sensex
-11%
-33%
-39%
BRIEF
2007A
FINANCIALS
Net Sales
2008A
2009E
4324.2
4943.2
5513.5
Sales
growth
24%
24%
14%
12%
EBITDA
619.7
832.8
976.3
1102.7
17.7%
19.3%
19.8%
20.0%
PAT
413.8
534.1
661.2
759.9
EPS
42.9
55.4
68.6
78.8
P/E (x)
21.8
27.0
22.2
19.3
102.5% 109.1% 103.7%
96.8%
RONW(%)
Ability to pass on the cost increases: Inspite of the steep
rise in the operating costs in CY08, the niche product offerings
have aided Nestle not only to grow volumes but also in
maintaining their margins (19-20%). We believe, the strong
product positioning will help Nestle maintain the margins (if not
increase) going forward.
Savings in tax rate: The new plant at Uttaranchal mainly for
convenience foods has started contributing to the production as
evidenced by the drop in tax rates from 34% in CY07 to 30% in
CY08. We believe that with the new plant’s increasing
contribution to total production, the effective tax rates will
reduce to 26-28% levels in CY09 & CY10.
Increasing urbanization of the Indian landscape: Urban &
semi-urban households are expected to increase at ~2.5-2.8%
CAGR over the next 5 years. We believe that the increasing
urbanization, rise in working women population & the growing
health consciousness augurs well for Nestles pro-urban product
lines.
VALUATION: Nestle is trading at substantial premium to its
peers like HUL, GSK Consumer & Colgate even on TTM basis at
the CMP of INR 1,520. The stock trades at 22.2x its CY09E and
19.3x CY10E EPS of INR 68.6 and INR 78.8 respectively. The
product positioning & increasing customer base provides sound
growth prospects over the long term.
We recommend
‘ACCUMULATE on dips’ for the stock with a price objective
of 15-17% upside over a period of 1-year.
KEY RISKS TO OUR CALL:
2010E
3500.7
EBITDAM
*E – Estimated, A – Audited
Nestle India Ltd. (NESTLE)
o
Fluctuations in key raw material prices.
o
Severe downturn in Indian economy.
2
23rd March 2009
KEY RATIONALE
Building up a portfolio with focus on health & nutrition
factor
There is a new wave engulfing the Indian FMCG industry –
‘Health Consciousness’. Various industries such as food,
hospitality, consumer durables (refrigerators) etc. are adapting
the health, nutrition, safety and wellness platform so as to
have a competitive edge by giving the consumer a healthy
alternative.
The introduction of healthy alternatives
across categories by various FMCG
players stands testimony to the growing
wellness trend…….
Recently, the Nielsen Company conducted a study on global
food labeling trends. It was an internet survey on Food
Labeling and Nutrition conducted across 51 countries.
Statistics revealed that in 2005, 32% Indians (mainly urban &
semi-urban) checked the food nutrition information on the
package as compared to 71% in 2008 (but only 59% of them
understood these labels). India tops the Asia Pacific region in
understanding of food labels. This re-iterates our stance of
growing health consciousness in India.
The introduction of healthy alternatives like ‘Saffola’ by Marico
in the edible oil space, fibre enriched biscuits by Britannia &
ITC, iodized salt by Tata, fortified atta by HUL, Women Horlicks
by GSK, calcium enriched milk by Amul & others stand
testimony to the growing wellness trend.
120
4
100
80
20
4
9
4
5
37
37
63
60
40
When you are buying packaged food,
when would you check the Nutritional
informationon the package?-Always
Break-up of Population Reading the
Labels and Understanding it
73
79
27
66
25
23
19
59
33
12
0
India
Malasia
Mostly
Japan
In part
23
29
China
Asia
Pacific
Not at all
Product realization to come down by
~10% in CY09…
India
Malasia
Japan
China
Asia
Pacific
Nestle has been an early follower of the nutrition ideology. It
identified the trends of growing urbanization, rising income
levels & increasing proportion of working women and
enhanced its product portfolio based on the convenience and
nutrition theme.
Nestle has through a combination of brand leveraging and
emphasis on the nutrition theme gained the confidence of the
working women population. Assured quality, quick to make,
hassle free and on top of that a healthy substitute to a home
cooked meal are the attributes that have augured well for all
Nestle’s nutrition based food and beverage products.
Existing Product Brands
Nutritive Brand Extensions
Maggi Instant Noodles
Maggi Dal Atta Noodles & Maggi Rice Noodles
Maggi Soup
Nestle Milk
Maggi Healthy Soups
Nestle Slim Milk
Nestle India Ltd. (NESTLE)
3
23rd March 2009
Niche Offerings
Nestle’s product offerings have gained in popularity because of
four reasons - convenience, quality, taste and niche
proposition. Through this combination Nestle has created
leadership position in the infant food, instant coffee, noodles,
condensed milk and chocolate wafer segment. Its brands have
become synonymous with the product itself. It’s strategy for
product entry has always been with the aim of creating a niche
for itself & hence managed to create and maintain market
leadership in its product offerings.
Survival in the functional foods business requires robust R&D
capabilities enabling a company to innovate and develop new
product lines on the health and nutrition platform.
R&D as a %age of sales
0.44%
0.38%
0.30%
0.5%
0.4%
0.3%
0.22%
0.2%
0.1%
Nestle enjoys an R&D edge over its peers due to support from
its parent company. Nestlé’s clear focus on health & nutrition
has enabled it to stay ahead of its peers and offer more
innovative products on the wellness platform.
0.21%
0.15%
CY07
CY06
CY05
CY04
CY03
CY02
0.0%
Ability to pass on cost increases
Two Year CAGR in Realisations
12.50%
11.20%
During H1CY08 FMCG players world over were faced with
rising agri-commodity prices. Inflation was the hanging over
the world and Nestle was forced to take price hikes across all
segments to account for these input cost pressures. Inspite of
the steep rise in the operating costs in H1CY08, the niche
product offerings have aided Nestle to grow not only in
volumes but also in maintaining their margins (20%). We
believe, the strong product positioning will help Nestle
maintain the margins (if not increase) going forward.
4.20%
Beverages
Milk
Products
&
Mutrition
Chocolates
Prepared
Dishes &
Cooking
2%
RESULTS TABLE
CY08
Net Sales
PBIDT
PBIDTM (%)
Interest
Depreciation
CY07
4,324.24
(INR in crs)
VAR.
3,500.65
23.53%
832.8
619.7
34.38%
19.3%
19.8%
1.6
0.9
92.94%
92.4
74.7
23.58%
PBT
772.8
628.6
22.94%
Tax
238.7
214.8
11.15%
30.9%
34.2%
-9.60%
534.1
413.8
29.07%
-
16.69*
534.1
430.5
24.06%
55.4
44.6
24.06%
Tax rates
PAT
Extraordinary Ex
Adj. PAT
EPS
Nestle’s focus is on overall profitable growth for which it
adopts a mix of both volume and realization growth strategies
while considering all external factors influencing such
decisions. In the 1990’s when the agri-commodities were in a
deflationary cycle Nestle emphasized on volumes growth.
Prices of vegetable oils have eased slightly in H2CY08 while
prices of other key inputs like wheat flour, sugar and milk have
increased marginally. Nestle has witnessed tremendous cost
pressure but still been able to maintain 19%+ margins for the
CY08. Topline growth at 24%, was a mix of realization growth
and volume growth.
Nestle enjoys pricing power as it is in a leadership position
across its product offerings. Apart from pricing Nestle has
been able to improve margins across all segments even in
such adverse conditions through cost efficiency programs,
fixed cost leveraging as it grows and product mix.
We believe that these cost pressures were temporary for and
that Nestle will be able to maintain 19-20% margins going
forward.
*Includes one time expense for VRS INR 75.73 crs. &
INR 59.04 crs of income on account of write back of a
provision for contingency for a litigation.
Nestle India Ltd. (NESTLE)
4
23rd March 2009
Prepared cooking
leading the growth
dishes
(PCD)
&
confectionaries
The convenience foods & chocolates have grown at 2 year
CAGR of 22.4% & 16.7% respectively. The PCD & chocolates
have registered strong YOY volume growth of 27-28% & 1920% resp. even during testing times in CY08.
The introduction of nutritional variants and availability at
attractive price points has enhanced penetration & spurred the
convenience foods & confectionary segment growth.
Strategic focus on the Popularly Positioned Products
(PPP) segment
PRICE
INR 10
INR 5
Nestles PPP segment is aimed at targeting new
consumers who are willing to transcend to
branded products as income levels increase. We
believe that the demand for products in this
category to be less price elastic and income
elastic.
PRODUCTS/BRANDS
Maggi Noodles, Kit Kat, Barone, Milkybar,
Nescafe Sunrise, Nescafe Classic,
Everyday
Maggi Noodles, KitKat, Milkybar,
Everyday, Munch, Nescafe Sunrise, Polo
INR 2
Nescafe Sunrise, KitKat, Munch, Milkybar,
Barone, Polo
INR 1
Nescafe Classic, Milkybar, Éclairs
INR 0.50
Éclairs, Polo, Tang Eez
PRICE POINT
16%
10%
17%
INR 0.5
PRODUCT CATEGORY
7%
53%
INR 1
INR 2
10%
Milk Products & Nutrition
Growth through PPP
Volumes (' 000MT) / SKUs (Nos.)
Revenues (INR Bn.)
The consumers in this segment are driven by
value for money and hence Nestle is leveraging
on its quality, taste and nutritional content to
popularize its PPP segment. Products in this
segment are priced in the range of INR 0.50 to
INR 10. Approximately 66% of the products in
the PPP segment are from the chocolates
segment.
INR 5
66%
Beverages
Chocolate & Confectionery
PPP ' 03
PPP ' 07
24 / 60
48 / 50
3.3
6.9
Revenues CAGR 2003-2007 %
20%
4%
INR 10
17%
Prepared dishes & cooking aids
Nestle has over the last 4-5 years
rationalized the number of SKU’s in this
segment but doubled its volume output.
The contribution of this segment has
increased from 21% in CY03 to 27% in
CY07.
The PPP segment has boosted volumes growth in the
convenience foods & the confectionary segment and has
proved to be a good defensive strategy for Nestle as it has
been able to retain its customers by offering products at
different price levels to meet various customer needs.
Nestle India Ltd. (NESTLE)
5
23rd March 2009
Increasing urbanization of the Indian landscape
According to the Urban Housing Policy Working Papers 20072012, urban households in India is expected to grow at a
CAGR of ~2.5-2.8% for the next five years. By 2012 India’s
urban cities will be handling ~ 75 mn households with an
average size of 4-5 members per household. This includes Tier
I, Tier II and Tier III cities.
Households (in mn)
75.01
66.3
55.8
40.7
2012P
2007E
These trends augur well for Nestles nutrition based convenient
foods & low fat milk segment. Nestles products are easy to
make & healthy substitutes versus home cooked snacks.
Nestles trusted brand quality has enabled it to create market
leadership in its product offerings and making it a preferred
choice in a mother’s shopping list for a healthy snack.
2001
Another trend arising out of growing urbanization is the
increasing proportion of working women in the workforce.
1991
19.1
1981
14.9
1971
29.3
1961
80
70
60
50
40
30
20
10
0
This transition in mindsets supported by the demonstration
effect to a certain extent will augur well for the PPP segment.
Nestle’s PPP segment is aptly placed to attract new consumers
at the entry level who want to shift to the branded segment.
Apart from this Nestle’s health and nutrition based product
lines will also benefit from increasing demand from the higher
income groups.
CONCERNS
Fluctuations in key raw material prices
Cost Trends for CY08 over CY07
20.0%
% Increase
16.0%
15.0%
13.4%
10.0%
5.0%
8.1%
8.6%
4.8%
Nestle India Ltd. (NESTLE)
Oils
Sugar
Milk
Powder
Milk
Wheat
Flour
0.0%
Nestle’s inputs are all agri-based, hence vagaries of
monsoon will impact the company’s sourcing and hence
profitability. In H1CY08 the company released its Indexed
cost data, which reflected a YOY increase in cost of all
major inputs as agri-commodity prices hardened. Nestle
was hence forced to take price hikes across segments so
as to maintain profitable growth. CY08 results show that
Nestle has not been able to pass on full cost increase and
margins fell below 20%. Prices of vegetable oils have
eased slightly in H2CY08 while prices of other key inputs
like wheat flour, sugar and milk have increased marginally.
The management is of the view that more price increases
will not be needed if input costs remain stable at this
level. Hence margin expansion is possible if the
management decides not to roll back prices. We believe it
will be able to come back to its historical 19-20%+
margins even if it intends to pass on the benefit of input
costs to consumers going forward.
6
23rd March 2009
INDUSTRY OVERVIEW
Transformation from food processor to
Health, Wellness and Nutrition
company…
Domestic food processing companies are looking for an image
makeover from mere food processors to Health, Wellness and
Nutrition Company. The rising trend of health consciousness in
the domestic urban population and increasing demand for
convenience food arising from the changing lifestyle, has
ushered in a health and nutrition revolution across the Indian
food industry.
Functional foods: scientifically
recognized as having physiological
benefits beyond those of basic
nutrition…
By definition functional food is very broad concept
encompassing within its definition every food preparation,
which is scientifically recognized as having physiological
benefits beyond those of basic nutrition. Examples include
margarine-style spreads that contain cholesterol-lowering
plant stanols, and probiotic fermented dairy drinks that
contain “friendly” bacteria, believed to improve gut health,
soya milks, & functional breakfast cereals.
Indian functional food companies
expected to grow at ~25 -30% on a
small base for the next five years…
This broad-based definition of functional foods makes it
difficult to get a consensus estimate of the industry size. A
leading food & beverage data analyzer Just-Food.com had
conducted a study in 2007 on India’s functional foods industry
and estimated revenues from this segment at USD 185 mn for
the year-end. According to their projections this industry is
expected to grow at a CAGR of 40-45% for the next 5 years
and grow in size to USD 1,161mn by 2012.
Functional foods business requires deep understanding of
consumers psyche and high technical expertise to develop the
suitable products. Our interaction with industry participants in
this segment has established that the brands launched in this
segment have been growing at more than 20-25% annually.
They are expected to maintain this growth momentum in the
future due to rising urbanization leading to demand for
convenience food providing at par nutritive value as home
made food.
Nestle India Ltd. (NESTLE)
7
23rd March 2009
COMPANY BACKGROUND
Leadership position in all core
categories…
A 61.85% subsidiary of Nestle S.A of Switzerland, Nestle india
has seven factory locations across the Indian geography.
Nestle operates in 4 segments: milk products & nutrition,
prepared dishes & cooking aids, beverages and chocolates.
Some of its established brands include Maggi, Nescafe,
Lactogen, Kit Kat and Milkmaid.
It enjoys leadership position in its core categories like baby
foods, instant noodles and instant coffee. Nestle has created a
niche for itself through its product offering.
Strategic focus on the health, wellness
and nutrition platform…
Nestle focuses on developing products around the nutrition,
health and wellness platform. Strong parental support along
with renovation and innovation in its offerings has enabled
Nestle to create a niche for itself.
Strong brand equity…
Over the years Nestle has built strong brand equity. This
strong brand equity has transcended into a strong brand recall
with the consumers and is evident from rising sales vis-a-vis
falling advertising spend to sales ratio from 20% in 2002 to
17.1% in 2007.
Source: Company
Nestle India Ltd. (NESTLE)
8
23rd March 2009
SEGMENT-WISE PERFORMANCE
MILK PRODUCTS & NUTRITION…
Product Profile
Revenue Contribution & Segment Growth
27.1%
22.6%
30%
25%
9.4%
43.7%
CY04
CY05
CY06
% of Total Revenues
15%
46.30%
9.0%
43.2%
9.1%
44.5%
20%
45.4%
47%
47%
46%
46%
45%
45%
44%
44%
43%
43%
42%
42%
10%
5%
0%
Milk Products and Nutrition is the largest segment
contributing 43-45% to the topline growing at
~12% CAGR over the last 5 years. Product
portfolio for this segment includes ghee, dairy
whiteners, packaged milk, Dahi (Curd), Fruit
Yogurt, baby & infant foods, cereals and
sweetened condensed milk. The contribution to
topline from this segment has been tapering since
last 4 years.
CY07 H1CY08
Segement Growth
Product Category
Brands
Nearest Competitor
Ghee
Everyday
Amul, Vijaya, Sagar etc.
Dairy Whitener
Everyday
Amul ( Amulya)
Packaged Milk
Nestle
Amul
Dahi
Nestle Fruit 'n' Natural
Amul, Mother Dairy etc.
Fruit Yogurt
Baby & Infant Food
Nesvita
Cerelac, Nan, Lactogen & Nestogen
Amul ( Amul Milk Powder)
Cereals
Cerevita
Kelloggs
Sweetened Condensed Milk
Milkmaid
Amul ( Mithai Mate)
Market Position
Apart from being No.1 in the baby and infant foods segment,
Nestle commands No. 1 position in the dairy whitener market
which is a niche product offering catering mainly to the
institutional clients. Nestle’s nutritional product offering in the
baby and infant foods segment has enabled it to garner No. 1
position in this segment. Nestle has created a strong brand
recall in this segment hence making it the preferred brand for
nursing mothers.
It has been a pioneer in the probiotic dahi segment – a niche
offering of dahi containing “friendly” bacteria which helps
improving metabolism and digestion. Nestle also has strong
presence in the sweetened condensed milk segment through
its brand Milkmaid.
Strategy
Brand Extension + Wellness Platform…
Nestle has launched brand extensions of its existing products
in the milk products segment while keeping health, wellness
and nutrition platform as the basis for its launch. Some
examples in this category include Everyday Slim (milk
powder), Nestle Slim Milk and Nestle Fresh ‘n’ Natural Slim
Dahi & NesVita Probiotic Dahi.
This segment is seeing a rationalization of volumes growth on
account of its maturing product line & sustained increase in
average realizations. Its contribution to the topline is tapering
as the company is laying emphasis on other more profitable
business segments like prepared dishes & cooking aids and
beverages.
Nestle India Ltd. (NESTLE)
9
23rd March 2009
Outlook
Dairy Market Breakup in Volume (MT)
Dairy Market Breakup in Value Terms
(INR Crs.)
180,000
159600
160,000
140
120
22.5
100
80
120,000
60
40
140,000
21.4
100,000
80,000
97.5
73.1
42680
60,000
20
40,000
0
20,000
2005
Liquid Milk
82835
2011
22980
9100
0
2005
Liquid Milk
Converted Products
Dominance of cooperatives…
4680
2011
Milk Powder Ghee
Milk and milk products form an essential part of the morning
meal for a majority of the global population irrespective of
age, culture or location. The milk-based food products market
in India has traditionally been dominated by cooperatives, thus
limiting the sourcing opportunities for private players. Many
multinational companies made attempts at cracking this
market but with little success.
Post-1992, some 15 domestic players entered the milk foods
market, but by the turn of the century more than half of them
folded. India’s dairy industry was largely ruled by cooperatives
and competing with them in terms of volumes, costs and
support was a far shot.
According to Dairy India 2007, of the total milk produced in
India (valued at around Rs 300,000 crore by different industry
players) only around 20% finds its way to the organized
sector. Of this 20%, half is managed by cooperatives and
government agencies.
Room for MNC’s to grow…
Organized retail convinience stores to
provide a platform for growth in this
segment…
Nestle’s position…
Dairy India 2007 survey estimates milk production to reach
120 mt by 2011 while consumption is expected to outstrip
production hence calling for more private participation in the
dairy sector. Clearly, there is room for MNCs and other
organized players to tap into this hugely unorganized market.
Emergence of large-scale convenience stores has improved the
market to a certain extent. There are better freezers and
storage facilities in supermarkets and retail outlets. The
consumers’ focus on healthier food options is also a reason for
companies to get into the fortified foods space, such as
probiotic. These store formats will give the necessary push to
the value added milk products segment as the urban
population moves up the value chain
Nestle has launched brand extensions of its milk products on
the nutrition and wellness platform. Nestle with its strong
brand and a head start in identifying this opportunity will
benefit with grocery retailing picking up in India.
Nestle India Ltd. (NESTLE)
10
23rd March 2009
PREPARED DISHES & COOKING AIDS…
Product Profile
“2 minutes” that’s the motto for this segment of Nestle. Maggi
is a household brand synonymous with instant noodles and
tomato ketchup. Product portfolio in this segment includes
instant noodles, tomato ketchup and soup mix. The
contribution of this segment to topline has been increasing
over the past 4 years from ~17.5% to 21.5%. This segment
has clocked a 17.4% CAGR over the last 5 years.
Revenue Contribution & Segment Growth
Product
Category
Nearest
Competitor
Brands
Ketchup
Maggi
Kissan
Instant noodles
Maggi
Top Ramen
(Nisin)
Soup
Maggi
Knorr
25%
20%
17.7%
19.0%
20.3%
30.6%
15%
10%
5%
21.4%
2.7%
19.3%
19.2%
CY05
CY06
23.10%
34%
0%
CY04
% of Total Revenues
CY07
40%
35%
30%
25%
20%
15%
10%
5%
0%
H1CY08
Segement Growth
Strategy
Two-pronged strategy – value addition
to existing brands and increase
penetration across various pricing
points…
The company has followed a two-pronged strategy in this
segment – leveraging existing brands to introduce value added
products on the same platform and increasing penetration
levels by offering the products across various pricing points.
The company has garnered strong volumes growth in this
segment on account of launch of maggi noodles in a smaller
pack priced at INR 5/- to cater to the demand from all income
levels.
The company has launched dal atta and rice instant noodles
keeping in mind its wellness drive. Maggi cup noodles have
also been launched to make maggi preparation even quicker
and more hassle free.
In the ketchup segment also Nestle has re-launched products
in smaller bottles and satchets. Apart from that the company
has launched new products in the chutney segment (Indian
sauces) to cater to the Indian taste buds.
Nestle has used its Maggi brand to launch instant soups
against market leader Knorr. Maggi soups have been able to
garner a little less than 50% share in this market. Maggi
followed the launch of the soups with the brand extension of
Maggi Healthy Soups.
Outlook
Increasing income levels in Tier I and
Tier II cities has ushered in an
opportunity for convenience food
industry to grow…
Increasing urbanization and growing proportion of working
women has given a boost to the Indian ready to eat food
market. Tier II and Tier III cities are also witnessing an
increase in general income levels hence increasing their
purchasing power. All these factors when put in perspective
ushers an opportunity for convenience foods industry to grow
faster.
If these food preparations are backed by nutrition and health
themes and are available at reasonable prices then this
segment can clock even higher growth as is being seen by the
functional foods industry presently in India. Nestles branding
of Maggi as a healthy convenient snack has enabled it to
maintain top spot in the instant noodle segment.
Nestle India Ltd. (NESTLE)
11
23rd March 2009
Nestle’s Position…
Nestle’s leadership position in instant noodles and ketchup
segment and launch of brand extensions of the same on
nutrition based platform will help it grow even faster and
garner higher market share.
BEVERAGES…
Product Profile
Nestle’s second most powerful brand (after Maggi) if
not the first is Nescafe – its instant coffee brand.
Regular coffee drinkers express desire to have a
Nescafe synonymous to desire of drinking a hot cup
of coffee. Apart from instant coffee this segment
includes other brands such as Nestea (iced tea) and
Milo (brown drink mix). This segments contribution
has been tapering off from 22% to 20% over the
last four years. This segment has grown at 8.1%
CAGR over the last 5 years.
Revenue Contribution & Segment Growth
25%
25%
16.6%
9.7%
10.4%
10%
19.8%
15%
20%
20.5%
22.0%
20%
22.2%
19.4%
15%
10%
Nestea was launched in both lemon and peach
flavor. Nestea fast picked up in popularity and is now
the official iced tea brand at various eateries. Nestea
powder mix was also brought to the doorstep of the
retail consumer through the launch of various size
retail packs.
5%
5%
3.9%
-3.2%
0%
0%
-5%
CY04
CY05
CY06
% of Total Revenues
CY07
In the brown drinks market, Nestle Milo has been
positioned as a healthy option for growing kids.
Unlike the other two products in this segment the
brown drinks market is highly competitive with
Bournvita and Complan commanding more than
80% of the market.
H1CY08
Segement Growth
Product Category
Brands
Nearest Competitor
Instant Coffee
Nescafe
Bru
Ice Tea
Nestea
Lipton
Brown Drinks
Milo
Complan, Boost, Horlicks & Bournvita
Retail coffee vending targeting the
mass…
Nestle’s approach…
Nestle is different from a Café Coffee Day or a Barista as it has
adopted different strategy to increase its penetration level. At
the institutional level Nestle’s Nescafe faces stiff competition
from Lipton & the emerging Café Coffee Day vending SBUs.
Instead of catering to a specific age group or income bracket
Nestle has adopted a mass market strategy.
Nestle wants its coffee to be accessible to every income group
and age group. Nestle plans to increase its penetration in the
coffee vending business by following a franchisee approach.
Nestle identifies locations at educational institutions, business
complexes, malls etc. to set up café and increase its vending
business. Nestle believes that these franchisees are like
laboratory for its product launches. One such launch has been
of Nescafe cold coffee which has become an instant hit in
Nestle beverage line up. At the retail level Nestle is pushing for
volumes growth through the launch of one person serving
sachet’s at affordable price.
Outlook
Coffee popularity is gaining momentum
with coffee retailing picking up …
Nestle India Ltd. (NESTLE)
India is primarily a tea drinking market. Coffee popularity is
gaining momentum with coffee retailing picking up. Coffee
joints like Café Coffee Day and Barista have worked to
popularize coffee as a beverage and have educated the
consumer about the product and its varieties.
12
23rd March 2009
With growing awareness of coffee as a beverage, Nescafe will
be a main beneficiary at the retail level as it will be able to
satisfy the consumer’s want of a good trusted quality, easy to
make, affordably priced coffee to make at home.
In the last three years, domestic consumption of coffee has
gone up steadily, with out-of-home consumption of coffee
growing at a faster rate of 12-13 per cent. Coffee consumption
in India is expected to rise by another 10% in the upcoming
crop year starting October to reach one lakh metric tons by
2009.
Iced tea is transforming the soft drinks market by becoming a
healthy substitute to aerated drinks and hence a necessary on
the menu cards at every restaurant, club or gathering.
CHOCOLATES & CONFECTIONERIES…
Product Profile
Revenue Contribution & Segment
Growth
16%
16%
15%
14%
24.8%
14.6% 14.5%
15%
14%
30%
15.5% 15.6%
18.5%
2.9%
25%
24.50% 20%
14.0%
11.0%
15%
10%
KitKat, Eclairs, Polo, Milkybar, Munch and Nestle
Chocolate bar are the chocolate offerings by Nestle
available across all price levels. This segments
contribution to topline has been increased from 14.6% to
15.6% in the last 4 years. Margins in this segment vary
from 10% - 20% depending upon the product mix and
pricing point. This segment has recorded a 12% CAGR for
the last five years. Nestle is at No.1 position in the wafer
chocolate segment.
5%
13%
% of Total Revenues
H1CY08
CY07
CY06
CY05
CY04
0%
Segement Growth
Strategy
Brand extension at various pricing
points…
Over the years Nestle has been able to grow in this segment
by launching brand extensions at various price points so as to
be able to cater to the demand of all segments. Volumes
growth is the main strategy in this segment. KitKat has been
growing the fastest in this segment.
Outlook
Estimated at INR 2,500 crs. the Indian chocolate industry is
led by Cadbury which has ~72% market share. Lower per
capita consumption of 300 gms in India vs. 1.9 kg in
developed nations presents an opportunity for high growth in
the Indian chocolate industry.
Nestle has created a niche for itself by emphasizing on mint
segment and wafer chocolate segment. Brand Equity & pricing
point are the main drivers for this segment of business. With
increasing raw material prices for chocolates this segment is
likely to undergo price hikes in the near future.
Nestle India Ltd. (NESTLE)
13
23rd March 2009
PEER COMPARISON
COMPANY NAME
GSK Consumer Ltd.
Colgate Palmolive
HUL
Nestle India Ltd.
NET
SALES
SALES
3-YR CAGR
1,542.78
12.31%
PAT
3-YR CAGR
PRICE
MCAP/
SALES
188.33
20.70%
03.9
PAT
P/E
DIV.
YIELD
1.6
13.5
2.48%
1,630.68
19.14%
268.78
25.66%
460.6
3.8
23.3
3.26%
16,345.19
13.90%
2,101.48
15.77%
233.0
3.1
24.2
3.86%
4,324.24
20.41%
534.08
19.94%
1,520.3
3.4
27.4
2.80%
Note: Sales and PAT figures are for CY08. Colgate is Dec. ending hence figures are TTM ending CY08. Price as on 20th March 09
Actually there is no one to one competitor for Nestle hence we
have conducted a peer comparison of Nestle vs. other FMCG
MNC’s in India having presence across segments. As can be
seen from the table above Nestle has always traded at a
premium to its peers. This is primarily because Nestle has
created niches for itself through distinct product offerings and
thereby creating a leadership position in these segments.
Nestle commands a premium over its peers because of market
leadership in segments it operates in, trusted quality, and its
brand equity.
VALUATION
Nestle has over the years created a trusted brand for itself in
FMCG space. Over the years Nestle has understood the needs
of the domestic consumers and strived to meet their
expectations while assuring quality, taste, convenience and
affordability. Nestle has provided employment to over 1 million
people across India. Nestle has created a niche for itself
through its product offerings and hence created market
leadership in the segment in operates in.
Nestle is trading at substantial premium to its peers like HUL,
GSK Consumer & Colgate even on TTM basis at the CMP of
Rs.1,520. The stock trades at 22.2x its CY09E and 19.3x
CY10E EPS of INR 68.6 and INR 78.8 respectively. The product
positioning & increasing customer base provides sound growth
prospects over the long term.
We recommend
‘ACCUMULATE on dips’ for the stock with a price
objective of 15-17% upside over a period of 1-year.
Nestle India Ltd. (NESTLE)
14
23rd March 2009
FINANCIAL SUMMARY
(in INR crs.)
INCOME STMT.
CY07A
Net Sales
CY08A
CY09E
CY10E
3501
4324
4943.2
5513.5
2880.9
3491.5
3966.9
4410.8
619.7
832.8
976.3
1102.7
84.5
34.1
35.0
38.0
0.9
1.6
1.0
1.0
703.4
865.2
1010.3
1139.7
74.7
92.4
92.0
98.0
PBT
628.6
772.8
918.3
1041.7
Tax
214.8
238.7
257.1
281.8
PAT
413.8
534.1
661.2
759.9
0.0
0.0
0.0
0.0
413.8
534.1
661.2
759.9
42.9
55.4
68.6
78.8
Total Expenditure
PBIDT
Other Income
Interest
PBDT
Depreciation
Extraordinary Adj.
Adjusted Profit
EPS
(in INR crs.)
BALANCE SHEET
CY07A
Share Capital
CY08E
CY09E
CY10E
96.4
96.4
96.4
96.4
322.0
464.3
617.8
759.2
0.0
0.0
0.0
418.4
560.8
714.2
855.6
Secured loans
2.9
5.9
2.9
2.9
Unsecured loans
0.0
0.0
0.0
0.0
Total Debt
2.9
5.9
2.9
2.9
421.3
566.6
717.1
858.5
1179.8
1353.8
1453.8
1553.8
Less: Dep
578.0
664.0
756.0
854.0
Net Assets
601.8
689.8
697.8
699.8
73.7
0.0
0.0
0.0
Reserves & Surplus
Less: ME & RR
Net Worth
Minority interest
Sources of fund
Gross Assets (Net of revaluation)
CWIP
Investments
94.4
169.4
219.4
359.4
Current Assets
637.9
731.7
787.7
875.3
Inventory
401.2
399.9
456.5
507.5
Debtors
53.5
94.6
67.7
90.6
Cash & Bank
37.8
76.8
88.1
96.7
Advances
145.4
160.4
175.4
180.4
Current Liabilities & Prov.
986.5
1024.3
987.8
1076.0
Current Liabilities
460.0
543.0
587.0
652.7
Provisions
526.5
481.2
400.7
423.3
Working Capital
-348.6
-292.6
-200.1
-200.7
Uses of Funds
421.3
566.6
717.1
858.5
Nestle India Ltd. (NESTLE)
15
23rd March 2009
(in INR crs.)
RATIO ANALYSIS
CY07A
CY08E
CY09E
CY10E
PROFITABILITY RATIOS
PBIDT(%)
17.7%
19.3%
19.8%
20.0%
PBDT(%)
20.1%
20.0%
20.4%
20.7%
PBT(%)
18.0%
17.9%
18.6%
18.9%
PAT(%)
11.8%
12.4%
13.4%
13.8%
Tax Rate(%)
34.2%
30.9%
28.0%
27.1%
RoCE(%)
152.3%
156.8%
143.2%
132.4%
RONW(%)
102.5%
109.1%
103.7%
96.8%
EPS
42.9
55.4
68.6
78.8
P/E
21.8
27.0
22.2
19.3
CEPS
50.7
65.0
78.1
89.0
BV
43.4
58.2
74.1
88.7
DPS
33.0
42.5
45.0
55.0
EV/EBITDA
23.6
17.5
14.9
13.2
0.0
0.0
0.0
0.0
Net Sales
24%
24%
14%
12%
PBIDT
20%
34%
17%
13%
Adj.PAT
31%
29%
24%
15%
5.6
6.3
7.1
7.9
43
42
39
40
6
6
6
5
53
52
52
51
13.4%
4.4%
3.8%
3.6%
0.6
0.7
0.8
0.8
VALUATION RATIOS
Debt/NW
GROWTH RATIOS
Net Sales to Net FA (x)
LIQUIDITY RATIOS
Inventory (Days)
Debtors (Days)
Creditors (Days)
Other Income / PBT
Current Ratio
Nestle India Ltd. (NESTLE)
16
23rd March 2009
Corporate Office:
nd
Manu Mansion, 2
Floor, 16, Shahid Bhagatsingh Marg, Fort, Mumbai 400 001. Tel. 91-22–6633 8900 / 2261 8787 / 4027 8900
Fax No. 91-22 – 2269 0041
Email: research@technogroup.co.in
website: www.technoworld.in
Strictly for Private Circulation only. All rights reserved. © Techno Shares & Stocks Ltd
DISCLAIMER: This information & opinions in this report have been prepared by TECHNO SHARES & STOCKS LTD. The report & the information
contained herein are strictly confidential and meant solely for the authorized recipient and may be restricted by law or regulation in certain
countries. This report is for information purposes only for the authorized reader and does not construe to be any investment, legal or taxation
advice. This report is based on the information obtained from public sources and sources believed to be reliable, however, no warranty, express or
implied, are given for the accuracy or correctness of the same and it should not be construed as such. It is also not intended as an offer or
solicitation for the purchase and sale of any financial instrument.
Techno Shares & Stocks Ltd and/or its subsidiaries and/or directors, employees, officers or associates – including the persons involved in the
preparation/issuance of this report may have (a) from time to time, any interest or positions (buy/sell etc.) – financial (including in
derivatives/commodities market) or otherwise in the companies/securities covered/mentioned in this report and may have acted upon the
information &/or (b) been engaged in any other transaction, commercial or otherwise, in respect of the companies/securities covered in this
report, like earning brokerage, commission or act as a market maker &/or (c) performed or may seek to perform any merchant/investment
banking services for such companies or act as advisor or lender/borrower to such companies &/or (d) have other possible conflict of interest with
respect to any recommendation or any information/opinions that could affect the objectivity of this report. As a result, the authorized recipients of
this report should rely on their own investigations and analysis & seek professional advice. Any action taken by any one solely on the basis of the
information contained herein is their own responsibility alone and Techno Shares & Stocks Ltd and its subsidiaries or its directors, employees or
associates will not be liable in any manner whatsoever for the consequences of such action taken.
No data/information contained in this report shall be copied, forwarded, transmitted or distributed, in part or in whole, in any form
or in any media, without the previous written consent of Techno Shares & Stocks Ltd.
Nestle India Ltd. (NESTLE)
17
23rd March 2009


