1 Heriot-Watt University M.Sc. in Actuarial Science Life Insurance
advertisement
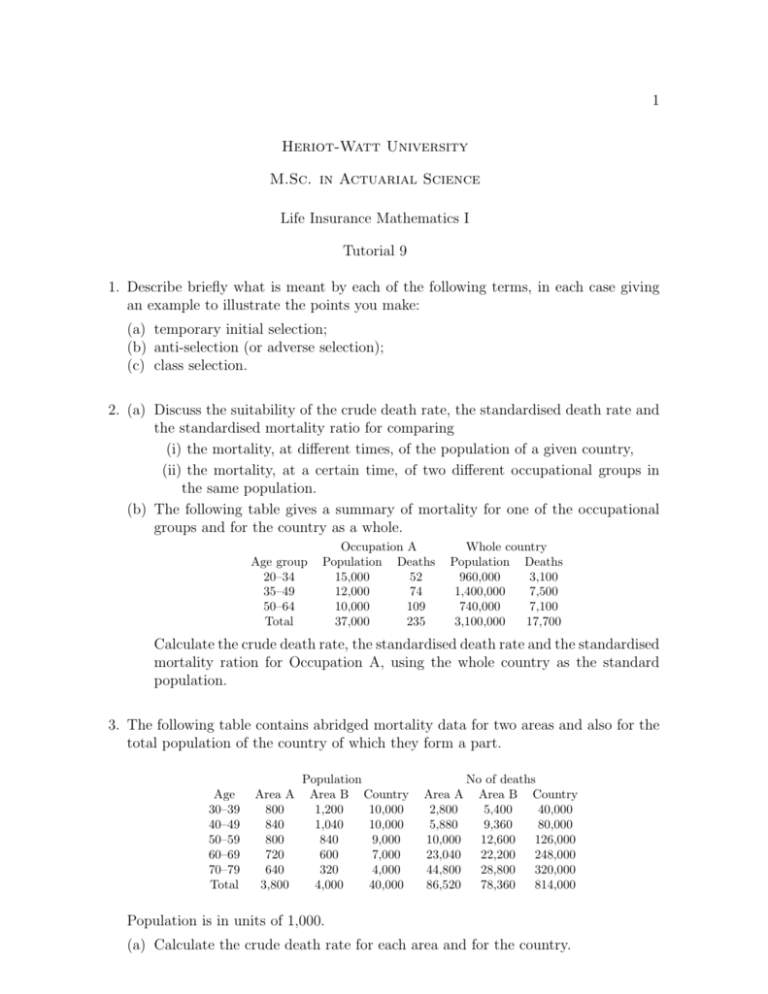
1 Heriot-Watt University M.Sc. in Actuarial Science Life Insurance Mathematics I Tutorial 9 1. Describe briefly what is meant by each of the following terms, in each case giving an example to illustrate the points you make: (a) temporary initial selection; (b) anti-selection (or adverse selection); (c) class selection. 2. (a) Discuss the suitability of the crude death rate, the standardised death rate and the standardised mortality ratio for comparing (i) the mortality, at different times, of the population of a given country, (ii) the mortality, at a certain time, of two different occupational groups in the same population. (b) The following table gives a summary of mortality for one of the occupational groups and for the country as a whole. Age group 20–34 35–49 50–64 Total Occupation A Population Deaths 15,000 52 12,000 74 10,000 109 37,000 235 Whole country Population Deaths 960,000 3,100 1,400,000 7,500 740,000 7,100 3,100,000 17,700 Calculate the crude death rate, the standardised death rate and the standardised mortality ration for Occupation A, using the whole country as the standard population. 3. The following table contains abridged mortality data for two areas and also for the total population of the country of which they form a part. Age 30–39 40–49 50–59 60–69 70–79 Total Area A 800 840 800 720 640 3,800 Population Area B Country 1,200 10,000 1,040 10,000 840 9,000 600 7,000 320 4,000 4,000 40,000 Area A 2,800 5,880 10,000 23,040 44,800 86,520 No of deaths Area B Country 5,400 40,000 9,360 80,000 12,600 126,000 22,200 248,000 28,800 320,000 78,360 814,000 Population is in units of 1,000. (a) Calculate the crude death rate for each area and for the country. 2 (b) Calculate the directly standardised death rate for each area, standardising on the country’s population. (c) Calculate the standardised mortality ratios for each area, using the country’s data as the standard. 4. The following data have been extracted from an investigation into the mortality experience in two regions of a country, and in the whole country. Age 0–19 20–39 40–59 60+ All Region 1 1 c Ex 220 140 110 100 570 Region 2 2 c Ex 180 220 260 360 1,020 Country s Exc µx 2,300 0.00106 2,520 0.00160 2,600 0.01100 2,800 0.05100 10,220 0.01744 s 1 Exc and 2 Exc are the central exposed to risk (equivalent to mid-year population) over each age range shown, for Region 1 and Region 2 respectively, in units of 1,000. s c Ex and s µx are respectively the central exposed to risk, in units of 1,000, and the observed rate of mortality for the whole country over each age range. The observed numbers of deaths in Region 1 and Region 2 were 9,800 and 19,620 respectively. (a) Calculate the crude death rate and standardised mortality ratio for each region. (b) Comment on your results in part (a). (c) Based on your calculations, which region do you think experiences heavier mortality? 5. A first year actuarial student has stated that he does not believe that ‘social class’ has any influence on mortality in the modern age. Discuss this statement, explaining why you agree or disagree with the student. 6. You have been asked to comment on the following table of standardised mortality ratios (SMR’s) for males which have been calculated for a large industrialised country. Occupation Teachers Economists, accountants, statisticians Judges, barristers, solicitors Ministers of religion Foreman, paper processing Construction workers Chemical plant workers General labourers SMR 62 69 77 78 83 133 161 195 In particular, discuss factors which would explain the differences between occupations.
